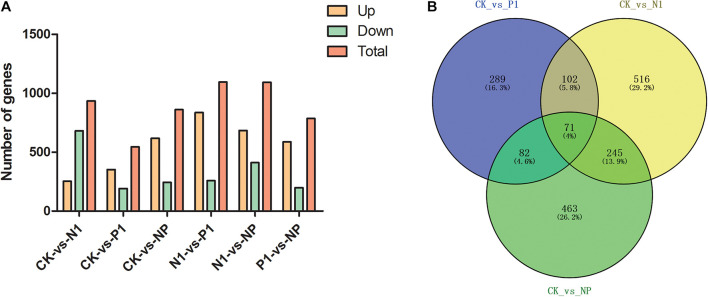
FIGURE 2.
Distribution of differentially expressed genes (DEGs) in the six samples. (A) DEG distribution between control and nitrogen and phosphorus limitation. (B) Venn diagram exhibiting DEG distribution in three samples. CK, the control; P1, the single P limitation (P-); N1, the single N limitation (N-); NP, N deep limitation and P limitation (N- -P-).

