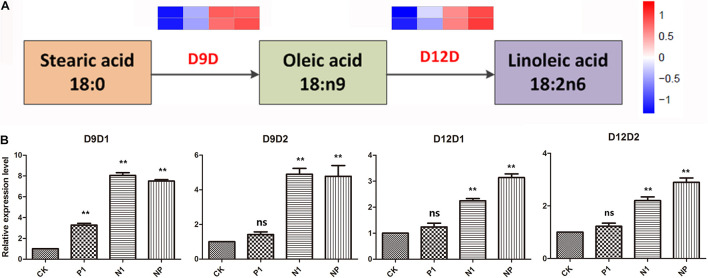
FIGURE 5.
DEGs are involved in the linoleic acid biosynthesis pathways and the changes of C18 fatty acid in response to different nitrogen and phosphorus limitation. (A) The expression pattern of DEGs involved in the linoleic acid biosynthesis pathways. (B) The relative expression levels of four genes in response to different nitrogen and phosphorus limitation. The bars represent the average (±SE) of biological repeats. Asterisks indicate statistically significant differences between groups (Student’s t-test): **p < 0.01, ns: no significant difference. CK: the control; P1: the single P limitation (P-); N1: the single N limitation (N-); NP: N deep limitation and P limitation (N- -P-).

