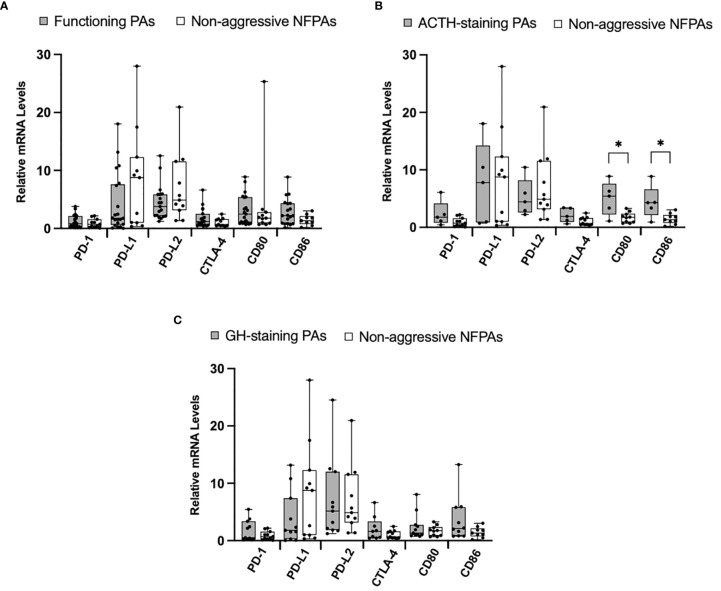
Figure 3.
Immune checkpoint molecule mRNA expression in functioning PAs compared to non-functioning PAs. (A) Comparison of relative mRNA levels of immune checkpoint molecules between functioning PAs (gray) and non-functioning non-aggressive PAs (white). (B) Comparison of relative mRNA levels of immune checkpoint molecules between ACTH-staining PAs (gray) compared to non-functioning non-aggressive PAs (white). (C) Comparison of relative mRNA levels of immune checkpoint molecules between GH-staining PAs (gray) compared to non-functioning non-aggressive PAs (white). *p < 0.05.

