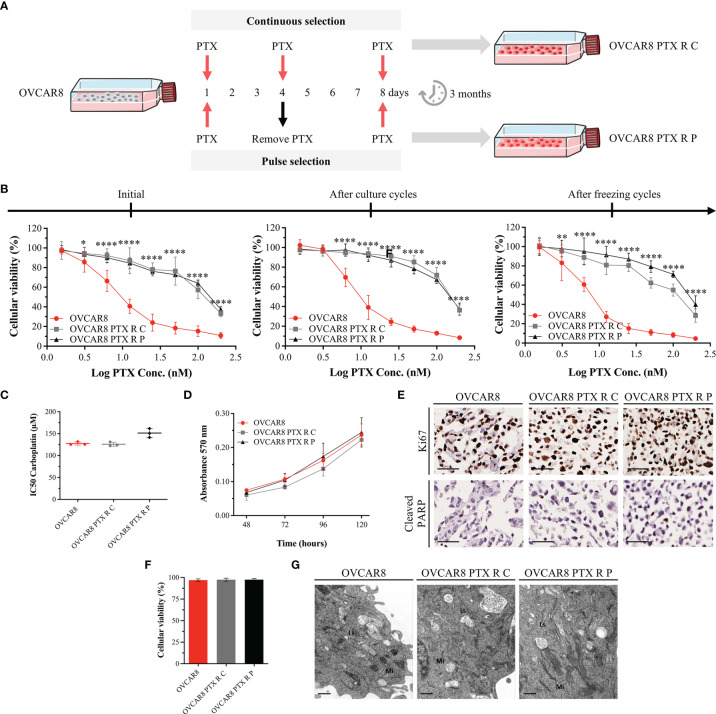
Figure 1.
OVCAR8 PTX R Variants Demonstrate High Resistance to PTX. (A) Experimental design used to generate two OVCAR8 PTX R variants using two different treatment approaches: continuous (C) and pulse (P) selection. (B) Line chart showing cell viability for PTX in OVCAR8 and OVCAR8 PTX R cell lines obtained by PB assay after exposure to PTX (1.56 to 200 nM) for 48 h. (C) Dot plot showing IC50 for Carboplatin in OVCAR8 and OVCAR8 PTX R cell lines obtained by PB assay after exposure to Carboplatin (3.12 to 400 µM) for 48 h. (D) Line chart showing cell proliferation of OVCAR8 and OVCAR8 PTX R cell lines obtained by MTT assay for 120 h. (E) Representative immunocytochemistry images for Ki67 and cleaved-PARP of OVCAR8 and OVCAR8 PTX R cell lines after 96 h in culture. (F) Bar chart showing cell viability of OVCAR8 and OVCAR8 PTX R cell lines determined by trypan blue exclusion assay after 48 h in culture. (G) Ultrathin sections of OVCAR8 and OVCAR8 PTX R cell lines showing the ultrastructure of mitochondria (Mi), lysosomes (Ls), Golgi complex (asterisk), and rough endoplasmic reticulum (RER, arrows). All assays were done in triplicate in at least three independent experiments. Data are expressed as mean ± standard deviation and plotted using GraphPad Prism Software Inc. v6. Statistical analysis was performed using ordinary two-way ANOVA followed by Tukey’s multiple comparison test (B, D) and ordinary one-way ANOVA followed by Tukey’s multiple comparison test (C, F), and values of *< 0.05; **< 0.001; ****< 0.0001 were considered statistically significant. Scale bar, 50 μm (E) and 0.5 μm (G) for immunocytochemistry images.

