Figure 2.
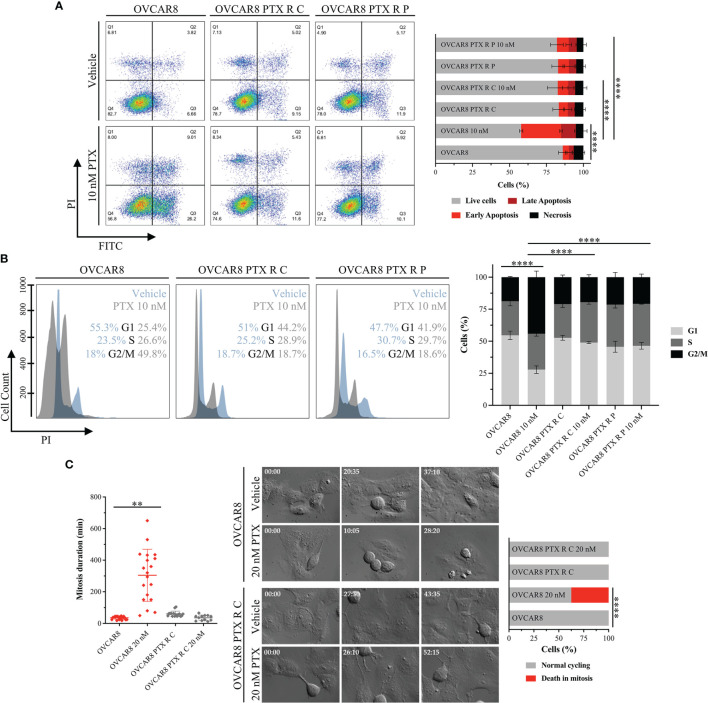
OVCAR8 PTX R Variants Overcome PTX-Induced G2/M Arrest and Apoptosis. (A) Representative flow cytometry dot plots and bar chart showing the percentage of cell populations—necrosis (Q1), late apoptosis (Q2), early apoptosis (Q3), and live cells (Q4)—of OVCAR8 and OVCAR8 PTX R cell lines using Annexin V/PI staining, after exposure to 10 nM PTX for 48 h. (B) Representative flow cytometry histogram and bar chart for cell cycle distribution (G1, S, and G2/M) of OVCAR8 and OVCAR8 PTX R cell lines using propidium iodide (PI) staining, after exposure to 10 nM PTX for 24 h. (C) Representative time-lapse images and corresponding dot plot for mitosis duration and bar chart for quantification of cell fate (normal cycling or death in mitosis) in OVCAR8 and OVCAR8 PTX R cell lines, after exposure to 20 nM PTX for 72 h. All assays were done in triplicate in at least three independent experiments. Flow cytometry was performed using BD FACS Canto™ II (BD Biosciences) flow cytometer and data were analyzed by FlowJo software v10.0.7. Data are expressed as mean ± standard deviation and plotted using GraphPad Prism Software Inc. v6. Statistical analysis was performed using ordinary one-way ANOVA followed by Tukey’s multiple comparison test (A–C) and two-way ANOVA followed by Tukey’s multiple comparison test (C), and values of **< 0.001; ****< 0.0001 were considered statistically significant. Scale bar, 100 μm for microscopic images.

