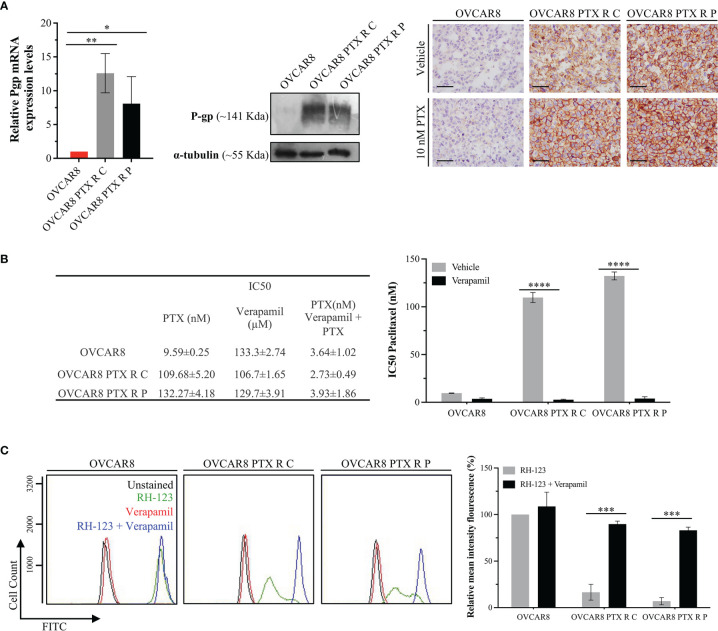
Figure 4.
OVCAR8 PTX R Variants P-gp Overexpression. (A) Bar chart showing relative P-gp mRNA expression levels in OVCAR8 and OVCAR8 PTX R cell lines determined by qRT-PCR with β-Actin used as housekeeping gene. Representative Western blot showing P-gp expression in OVCAR8 and OVCAR8 PTX R cell lines using α-tubulin as loading control. Representative immunocytochemistry images for P-gp expression in OVCAR8 and OVCAR8 PTX R cell lines, after exposure to 10 nM PTX for 48 h. (B) Table showing IC50 PTX (in the presence and absence of 10 µM Verapamil) and IC50 Verapamil for OVCAR8 and OVCAR8 PTX R cell lines obtained by SRB assay for 48 h. Bar chart showing IC50 PTX for OVCAR8 and OVCAR8 PTX R cell lines, obtained by SRB assay after exposure to 10-fold serial dilutions of PTX, in the presence or absence of 10 µM of Verapamil for 48 h. (C) Representative flow cytometry histogram and respective bar chart showing RH-123 accumulation using FITC-A intensity in untreated (unstained, black) and RH-123-treated (stained, green) cells in the presence (blue) or absence (red) of P-gp inhibitor (Verapamil) for OVCAR8 and OVCAR8 PTX R cell lines. All assays were done in triplicate in at least three independent experiments. Data are expressed as mean ± standard deviation and plotted using GraphPad Prism Software Inc. v6. Statistical analysis was performed using ordinary two-way ANOVA followed by Tukey’s multiple comparison test (A) or Šídák’s multiple comparison test (B, C), and values of *< 0.05; **< 0.001; ***< 0.0005; ****< 0.0001 were considered statistically significant. Scale bar, 500 μm for immunocytochemistry images.

