
Figure 1.
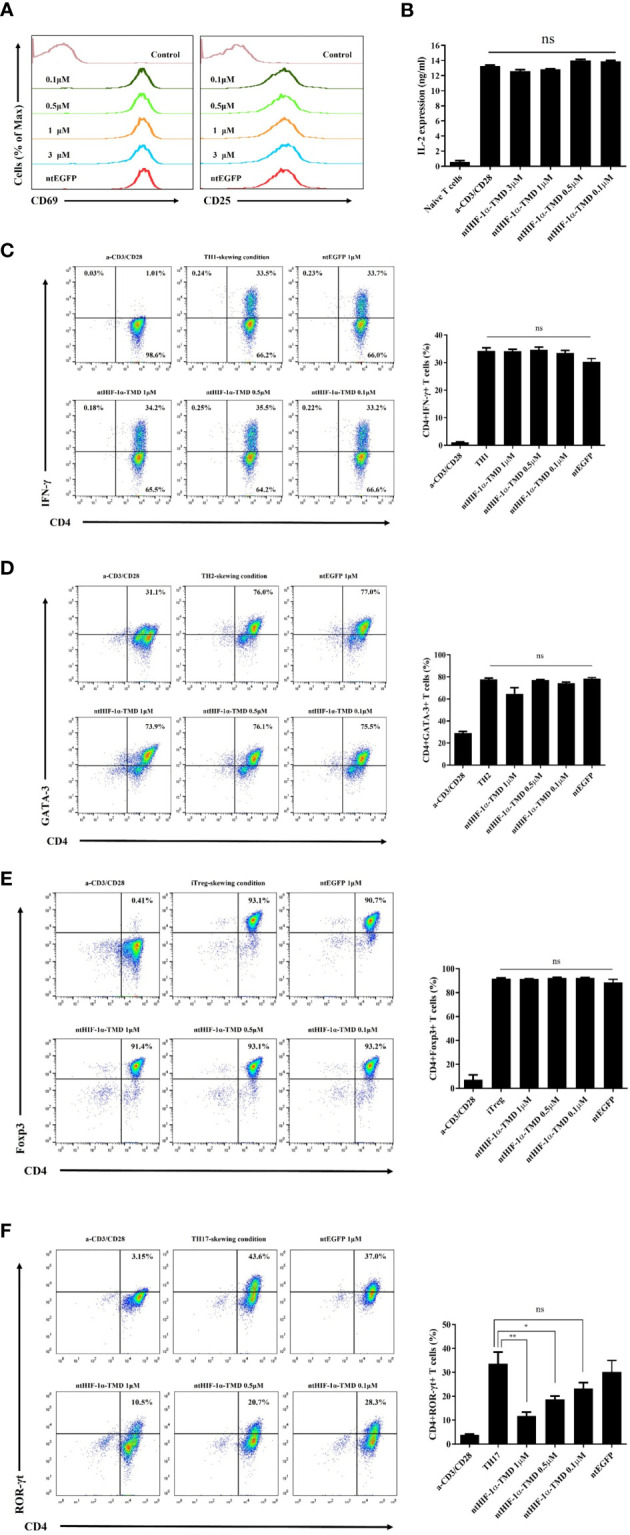
Examination of the functional influence of ntHIF-1α-TMD on CD4+ T-cell subsets. (A) The induced expression of the surface proteins associated with T-cell activation was analyzed by flow cytometry on CD4+ T cells activated by anti-CD3ϵ and anti-CD28 with or without ntHIF-1α-TMD treatment. Hph-1-PTD-fused enhanced green fluorescent protein (ntEGFP) was used as a negative control. (B) The secreted IL-2 in the supernatant from the cells in (A) was measured by ELISA. (C–F) The functional influence of ntHIF-1α-TMD on TH1, TH2, iTreg, or TH17 cells was evaluated by flow cytometry after 72 h incubation in the T-cell subset-skewing condition with ntHIF-1α-TMD. All experiments shown here were repeated three times. Data are represented as mean ± SEM (n ≥ 3), and the statistical analysis was examined using Student’s t-test. ns, not significant, *P < 0.05, **P < 0.01.