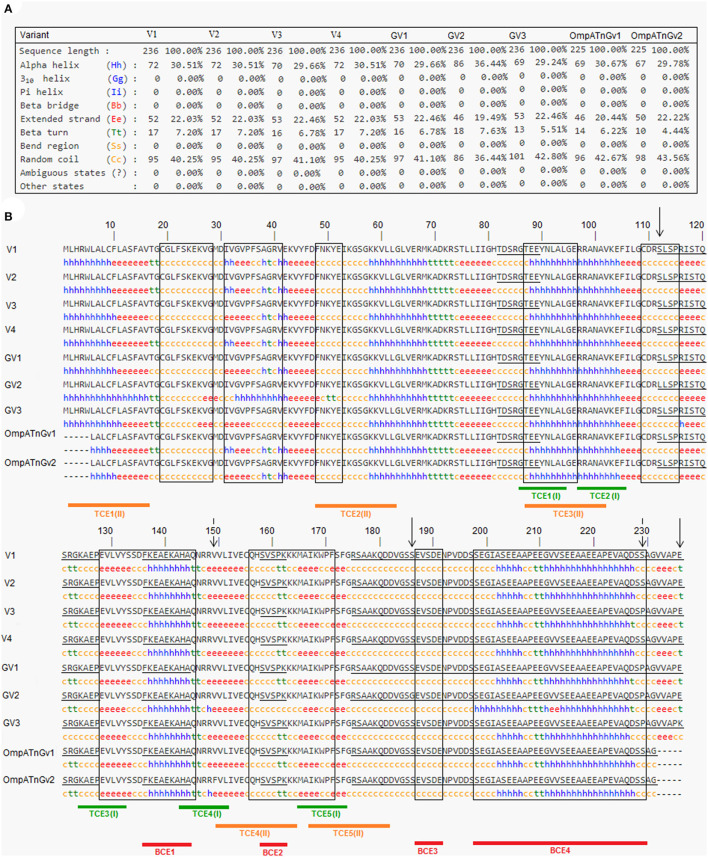
Figure 4.
Information on the secondary structure composition of OmpA proteins deduced from the nine genetic variants representing all Anaplasma marginale strains and isolates available in GenBank (A) and multiple alignment of predicted amino acid sequences and secondary structures of the OmpA proteins representing all A. marginale strains and isolates available in GenBank (B). Sequential and conformational epitopes linked to B cells are, respectively, underlined and boxed. Red lines represent epitopes (BCE1–BCE4), which are in common between sequential and conformational epitopes. The green and orange lines represent the epitopes [TCE1(I)–TCE1(I)] linked to MHC class I T cells and the epitopes [TCE1(II)–TCE1(II)] binding to MHC class II T cells. The positions where there are amino acid substitutions between the analyzed protein sequences are represented by descending arrows.

