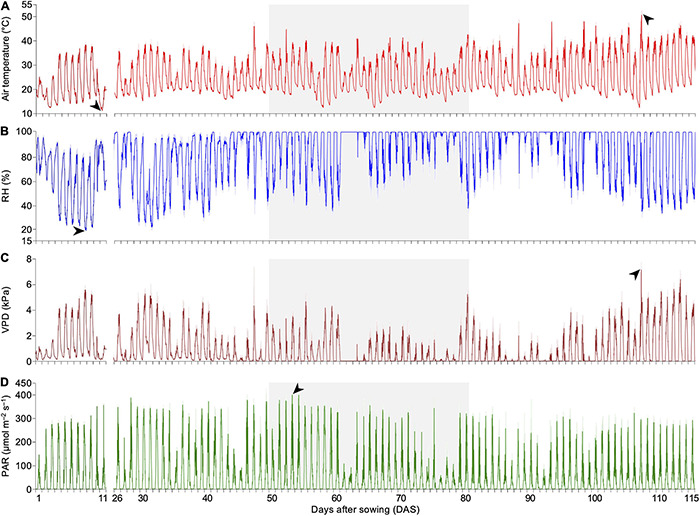
FIGURE 3.

Fluctuation of environmental parameters detected by the non-invasive real-time phenotyping platform. (A) Air temperature, with minimum and maximum observed at 11 DAS at 5:30 am (11.35 ± 0.05°C) and 107 DAS at 2:00 pm (51.38 ± 1.93°C), respectively (black arrows). (B) RH, with a minimum of 18.85 ± 0.15% at 8 DAS at 4:30 pm (black arrow). (C) VPD, found to reach a peak of 7.17 ± 0.60 kPa at 107 DAS at 2:15 pm (black arrow), following the high air temperature variation at that moment. (D) PAR, with a maximum peak of 400.53 ± 1.94 μmol m–2 s–1 observed at 53 DAS at 12:00 pm (black arrow). Gray background highlights period of DS treatment. Data points were missing from 12 to 25 DAS due to an unexpected disruption of the automated measuring routine. DAS, days after sowing; RH, air relative humidity; VPD, vapor-pressure deficit; PAR, photosynthetically active radiation; DS, drought stress.
