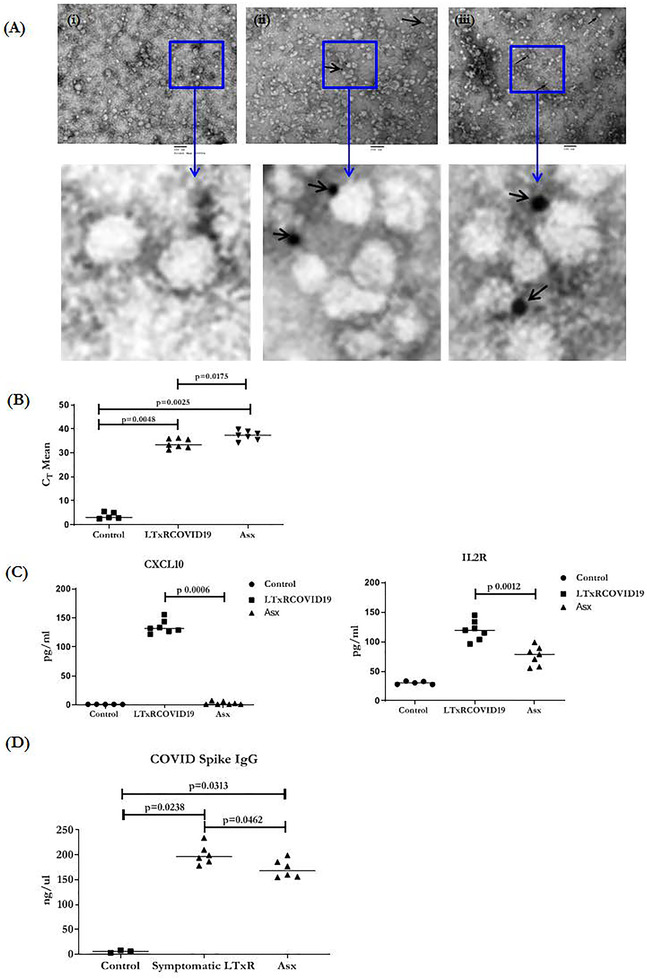
FIGURE 3.

TEM images of exosomes from LTxRs with known SARS‐CoV‐2 infection (LTxRs‐COVID‐19) and from asymptomatic LTx candidates (Asx). One each (i) negative control (ii) exosomes positive for SARS‐CoV‐2 spike protein from sample 1 (iii) exosomes positive for nucleocapsid protein from sample 2. Magnified views of images are given in panel below. Scale = 100 nm. (B) RT‐PCR of SARS‐CoV‐2 from exosomes of LTxRs‐COVID‐19 (n = 7) and Asx (n = 7). Data are presented as cT Mean. (C) Cytokine profiling data of LTxRs‐COVID‐19 (n = 7) and Asx (n = 7). Data are presented as pg/ml. (D) ELISA of SARS‐CoV‐2 spike antibody from mice at D28. Mice were immunized with COVID spike antigen positive exosomes isolated from LTxRs (LTxRs‐COVID‐19) and SARS‐CoV‐2 spike antigen positive exosomes isolated from SARS‐CoV‐2 RT‐PCR negative Asx. *All statistical analyses were performed using Mann–Whitney test using GraphPad Prism version 8.0
