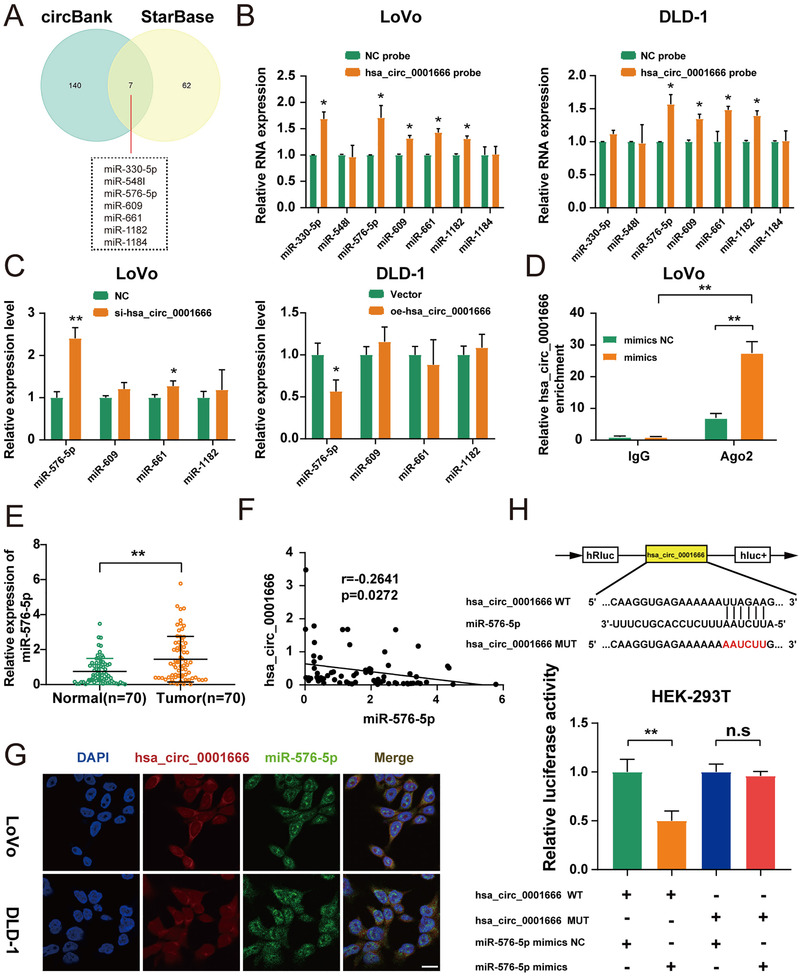
FIGURE 4.

Hsa_circ_0001666 binds to miR‐576‐5p directly in CRC cells. (A) Schematic illustration exhibited miRNAs of hsa_circ_0001666, based on circBank and StarBase. (B) Biotinylated hsa_circ_0001666 probe and an NC probe were used to pull down the candidate miRNAs in both LoVo and DLD‐1 cell lines, and expression levels were tested with quantitative real‐time PCR. The relative level of hsa_circ_0001666 was normalized to the level of NC. (C) Relative expression levels of four candidate miRNAs in treated LoVo and DLD‐1 cells. (D) Anti‐Ago2 RIP assay was executed in LoVo cells after transfection with miR‐576‐5p mimics and mimics NC, followed by qRT‐PCR to detect the expression of hsa_circ_0001666. (E) qRT‐PCR was used to identify the relative expression of miR‐576‐5p in CRC tissues and matched normal tissues (n = 70). (F) Pearson correlation analysis of hsa_circ_0001666 with miR‐576‐5p expression based on CRC tissues. (G) The locations of hsa_circ_0001666 (red) and miR‐576‐5p (green) in the cell were investigated using FISH. (magnification, 600×; scale bar, 100 μm). (H) The relative luciferase activities were detected in HEK‐293T cells after co‐transfection with hsa_circ_0001666‐WT or hsa_circ_0001666‐MUT and miR‐576‐5p mimics or mimics NC, respectively. Data were all represented as mean ± SD (n = 3); n.s indicated no significance, *p < .05, **p < .01
