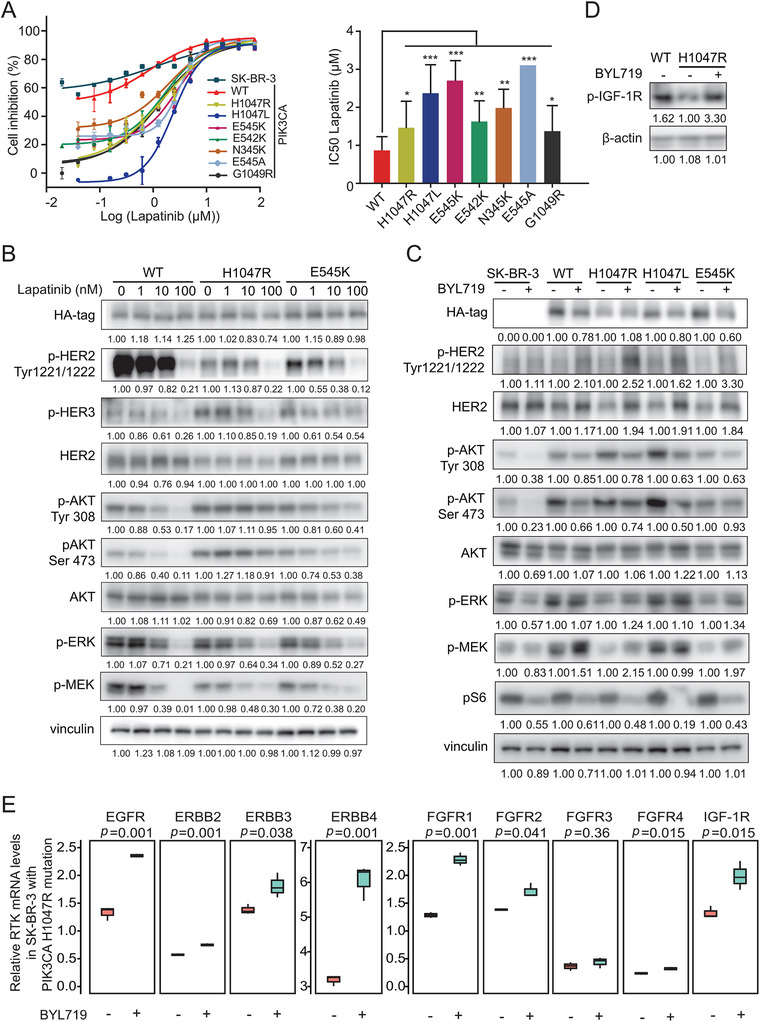
FIGURE 5.

PIK3CA functional mutations induce drug resistance to TKI but sensitivity to PI3Kα‐specific inhibitor. (A) Responses of SK‐BR‐3 cells expressing PIK3CA wild‐type and mutants to different doses of lapatinib treatment by CCK‐8 assay. Half‐maximal inhibitory concentration (IC50) values were calculated after drug treatment for 5 days. Quantitative results of IC50 values are shown (right). (B) Activation status of RTK‐PI3K‐MAPK pathway in SK‐BR‐3 cells stably expressing PIK3CA WT, PIK3CA H1047R, PIK3CA E545K, which were treated with the indicated concentration of lapatinib (1, 10, 100 nM) for 3 h. (C) Activation status of RTK‐PI3K‐MAPK pathway in SK‐BR‐3 cells stably expressing PIK3CA WT, PIK3CA H1047R, PIK3CA H1047L and PIK3CA E545K, which were treated with 500 nM BYL719 for 2 days. (D) Immunoblot of pIGF‐1R in SK‐BR‐3 cells stably expressing PIK3CA WT and PIK3CA H1047R were treated with 500 nM BYL719 for 2 days followed by insulin stimulation (100 nM) for 30 min. (E) Transcriptional expressions of RTKs in HER2+ cells expressing PIK3CA WT or PIK3CA H1047R which were treated with BYL719 (500 nM, n = 3). Data are presented as the mean ± SD. *p < .05, **p < .01, ***p < .001
