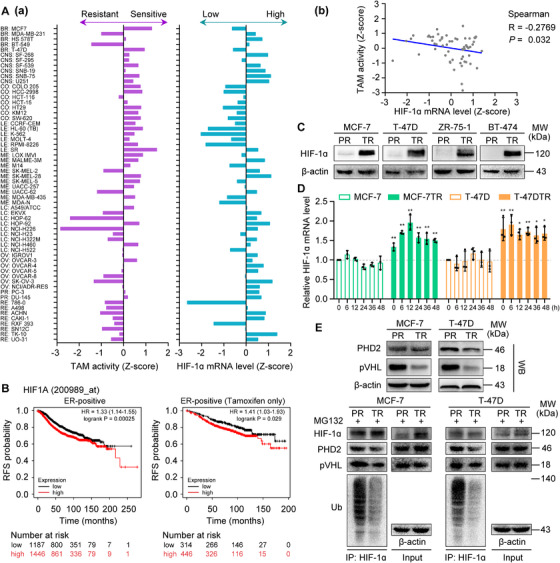
FIGURE 2.

Relationship between HIF‐1α expression and TAM therapeutic response in cancer cells and breast cancer patients. (A) HIF‐1α expression is negatively correlated with TAM therapeutic response in NCI‐60 cells. (a) Left: Sensitivity of NCI‐60 cells to TAM is represented by the Z‐score, with cells categorized as sensitive (0 to 3) or resistant (0 to −3). Right: HIF‐1α expression in NCI‐60 cells is represented by the Z‐score, with expression categorized as high (0 to 3) or low (0 to −3). (b) HIF‐1α expression is inversely correlated with the sensitivity of NCI‐60 cancer cells to TAM (Spearman R = −0.2769; p = 0.032). (B) Relapse‐free survival curves for patients with ER‐positive breast cancer (n = 2633) and patients with ER‐positive breast cancer receiving TAM alone (n = 760) according to the Kaplan–Meier plotter database. p values and hazard ratios (HRs) are shown. (C) HIF‐1α expression determined in parental (PR) and TAM‐resistant (TR) cells, with β‐actin used as the loading control. (D) HIF‐1α mRNA levels in parental and TAM‐resistant cells. mRNA levels were measured at the time points indicated after the culture medium was refreshed. Results were normalized to β‐actin mRNA levels and presented as the fold change compared with parental cells at 0 h (n = 3). Data are shown as mean ± SD. *p < 0.05, **p < 0.01, parental cells vs. TAM‐resistant cells at the same time point. (E) Expression levels of PHD2 and pVHL, and ubiquitination of HIF‐1α in parental (PR) and TAM‐resistant (TR) cells. Cells were pretreated with 10 μM MG132 for 12 h.
