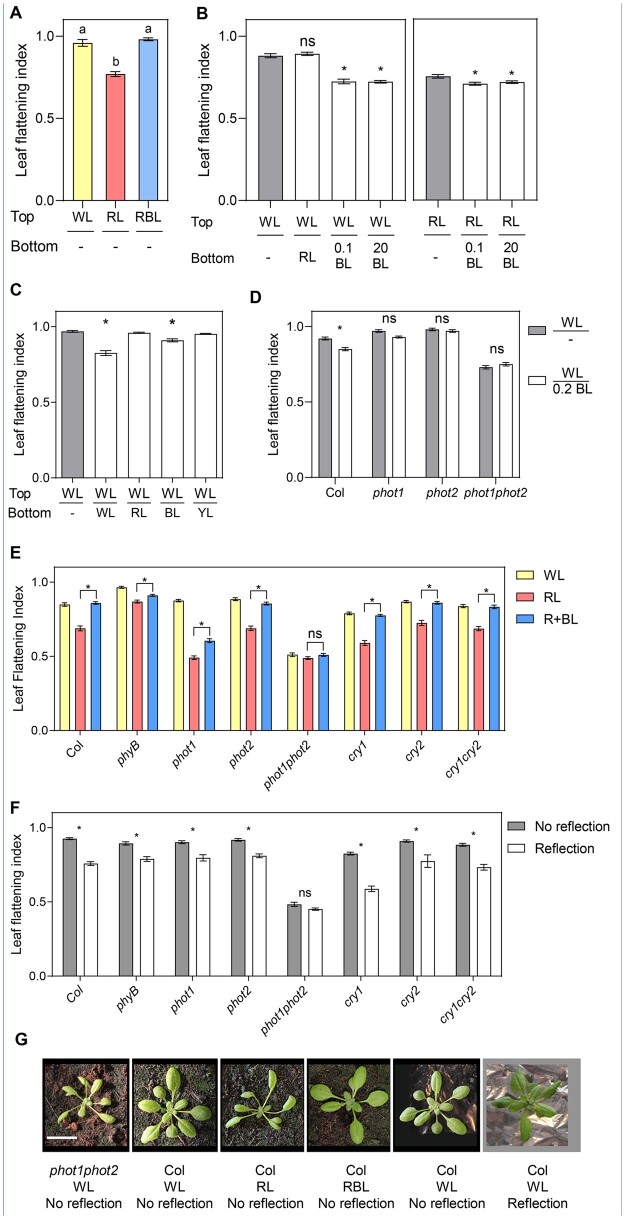
Figure 1.
Leaf shape responds to light direction in a phototropin-dependent manner. A, LFI in Col plants grown in plates for three weeks in WL, RL, or RBL. Bars represent mean ± se of 16–30 leaves. Different letters represent significant differences among means (P < 0.05) in an ANOVA followed by Tukey’s test. B, LFI in Col plants grown in plates for two weeks and transferred to WL or RL from the top supplemented with RL, 0.1 µmol m−2 s−1 blue light (0.1 BL) or 20 µmol m−2 s−1 BL (20 BL) from the bottom or dark bottom (−) for three days. Bars represent mean ± se of 56–60 leaves. *P < 0.05 in ANOVA followed by Dunnett’s multiple comparison test. In each case, treatments involving light from below were compared to the same light from the top (WL or RL) without light from below (gray bars). C, LFI in Col plants grown in WL for three weeks in soil covered with aluminum foil, which reflects various colors (see spectra of the reflected light in Supplemental Figure S1B). YL: yellow light. Bars represent mean ± se of 30–88 leaves. *P < 0.05 in ANOVA followed by Dunnett’s multiple comparison test. Treatments involving light from below were compared to the treatment without light from below (−, gray bar). D, LFI in Col and phototropin mutants grown in plates in WL for 2 weeks and transferred to WL from the top and darkness (−) or 0.2 µmol m−2 s−1 BL (0.2 BL) from the bottom for three days. Bars represent mean ± se of 34–92 leaves. *P < 0.05 in ANOVA followed by Sidak’s multiple comparison test between the two treatments for each genotype. E, LFI in Col and photoreceptor mutant plants grown in soil for 2 weeks and transferred to WL, RL, or RBL for 1 week. Bars represent mean ± se of 36–50 leaves. *P < 0.05 in ANOVA followed by Tukey’s multiple comparison test. The complete ANOVA results including comparisons with WL can be found in Supplemental Table S3. F, LFI in Col and photoreceptor mutant plants grown in WL for 3 weeks in soil covered with dark (No reflection) or clear (Reflection) aluminum foil. Bars represent mean ± se of 16–29 plants. *P < 0.05 in ANOVA followed by Sidak’s multiple comparison test. G, Representative pictures of phot1phot2 and Col plants grown in selected light conditions. Scale bar: 2 cm.

