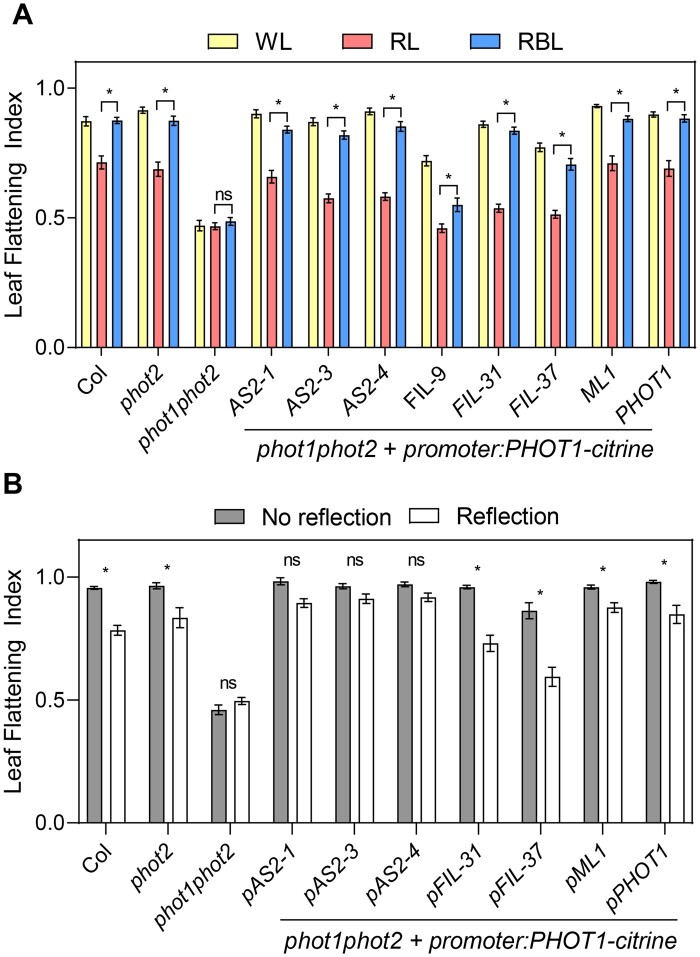
Figure 2.
The PHOT1 expression domain regulates leaf shape. A, LFI in plants grown in soil for two weeks and transferred to WL, RL, or RBL for 1 week. Bars represent mean ± se of 17–28 leaves. *P < 0.05 in ANOVA followed by Tukey’s multiple comparison test. The complete ANOVA results including comparisons with WL can be found in Supplemental Table S4. B, LFI in plants grown in soil covered with dark (No reflection) or clear (Reflection) aluminum foil for 3 weeks. pAS2-1, pAS2-3, pAS2-4, pFIL-9, pFIL-31, and pFIL-37 are independent transgenic lines expressing PHOT1-citrine under the promoters of ASYMMETRIC LEAVES2 (AS2) or FILAMENTOUS FLOWER (FIL), respectively. pML1 and pPHOT1 lines express PHOT1-citrine under the control of the MERISTEM LAYER 1 and PHOTROPIN 1 promoters, respectively. pAS2 drives PHOT1 expression in the adaxial domain, and pFIL in the abaxial domain. Bars represent mean ± se of 6–28 plants. *P < 0.05 in ANOVA followed by Sidak’s multiple comparison test.

