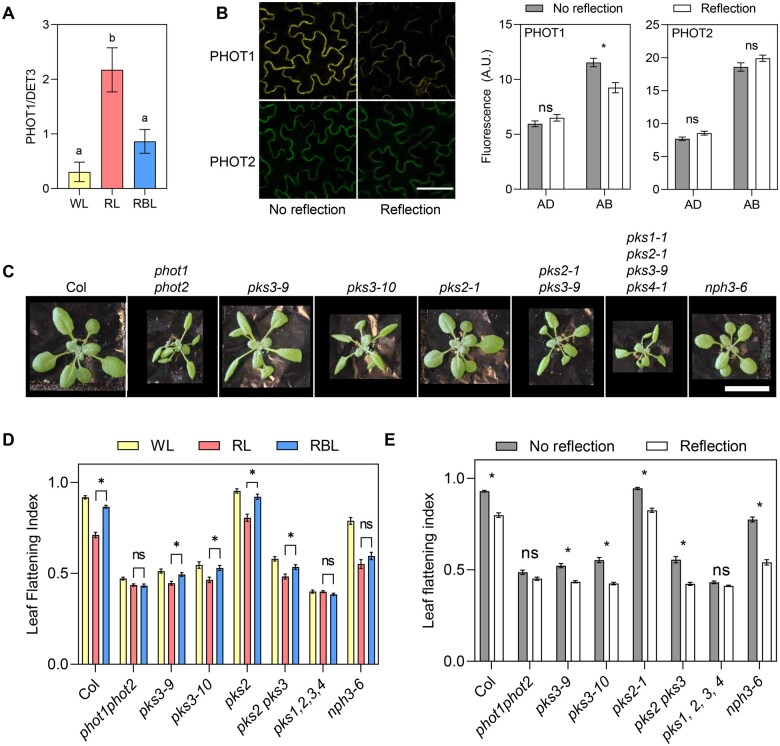
Figure 3.
Early phototropin signaling mechanisms in leaves. A, PHOT1 levels in leaf blades of 2-week-old Col plants transferred to WL, RL, or RBL for 1 d. Protein blots were probed with anti-PHOT1 antibody, and DET3 was used as a loading control. Quantification of western blots shown in Supplemental Figure S3A. Each bar represents mean ± se of eight replicates coming from two independent experiments. Different letters indicate significant differences among means in ANOVA followed by Tukey’s multiple comparisons test (P < 0.05). B, PHOT1 levels decrease in the abaxial epidermis in response to reflected light. Plants grown for 3 weeks on soil covered with dark (No reflection) or clear (Reflection) aluminum foil. Left: Confocal images of the abaxial epidermis of plants expressing pML1:PHOT1-citrine or pCER6:PHOT2-GFP. Scale bar 50 µm. Right: quantification of microscopy images. Each bar represents mean ± se of four replicates. *P < 0.05 in ANOVA followed by Sidak’s multiple comparisons test. C, Pictures of Col and phototropin, pks, and nph3 mutant plants grown for three weeks on soil with no reflection. Scale bar: 2 cm. D, LFI in plants grown on soil for two weeks and transferred to WL, RL, or RBL for one week. Bars represent mean ± se of 10–20 plants. *P < 0.05 in ANOVA followed by Tukey’s multiple comparison test. The complete ANOVA results including comparisons with WL can be found in Supplemental Table S5. E, LFI in plants grown on soil covered with dark (No reflection) or clear (Reflection) aluminum foil for 3 weeks. Bars represent mean ± se of 20–45 leaves. *P < 0.05 in ANOVA followed by Sidak’s multiple comparison test.

