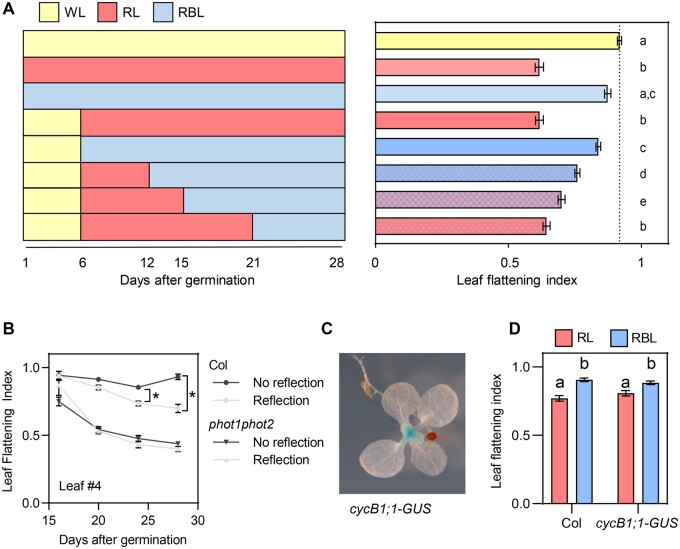
Figure 4.
Phototropins control leaf shape reversibly during the expansion phase. A, LFI of Col plants grown on soil and transferred to WL, RL, or RBL at different time points. Measurements were done 28 d after germination. Bars represent mean ± se of 40–48 leaves. Different letters represent significant differences among means (P < 0.05) in an ANOVA followed by Tukey’s test. Left: scheme of the treatments. B, LFI in Col and phot1phot2 plants grown on soil covered with dark (No reflection) or clear (Reflection) aluminum. Results correspond to leaf 4 during development since leaves are big enough to be measured. Each point represents mean ± se 8 to 11 plants. *P < 0.05 in ANOVA followed by Sidak’s multiple comparison test. Within each genotype, the effect of light was tested at each time point, and only the significant effects are shown. C, GUS staining of plants expressing cycB1;1-GUS grown on soil covered with clear (Reflection) or dark (No reflection) aluminum foil. Staining was performed 2 weeks after germination, when leaves 1 and 2 were more than 3-mm long, but before they respond to the light stimulus. D, LFI in plants expressing cycB1;1-GUS grown in WL for 2 weeks and transferred to RL or RBL for 1 week. Bars represent mean ± se of 16–22 leaves. Different letters represent significant differences among means (P < 0.05) in an ANOVA followed by Tukey’s test.

