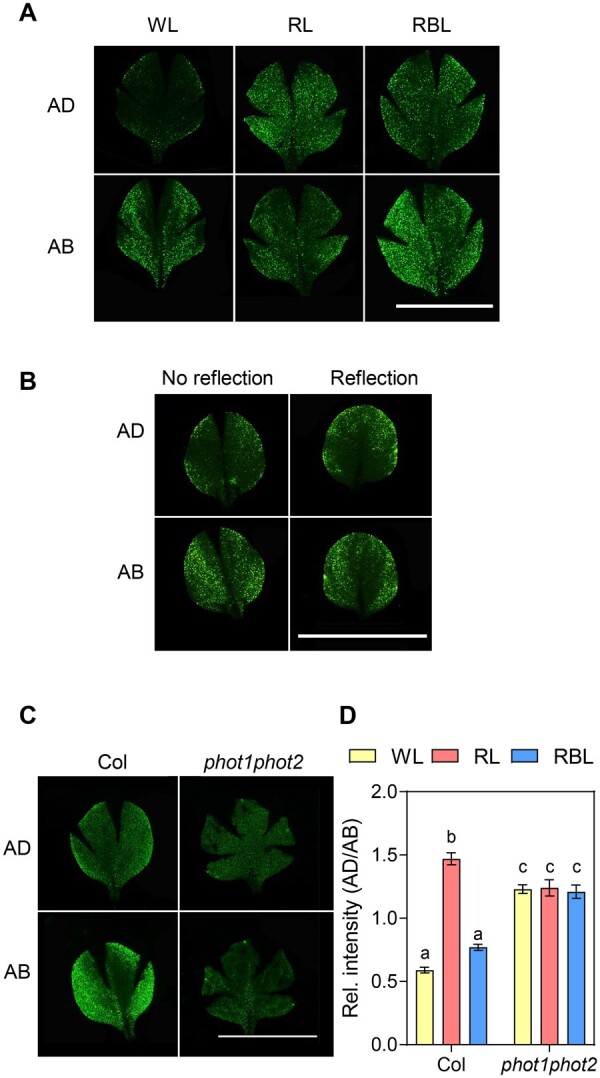
Figure 5.

Leaf shape correlates with the auxin signaling pattern in the blade. A, Epifluorescence images of leaf blades of 2-week-old plants expressing DR5:VENUS transferred for 1 week to WL, RL, and RBL. For each leaf, images were taken on the adaxial (AD) and abaxial (AB) side. Scale bar 1 cm. B, Epifluorescence images of leaf blades of plants expressing DR5:VENUS grown on soil covered with dark (No reflection) or clear (Reflection) aluminum foil for 3 weeks. For each leaf, images were taken on the AD and AB side. Scale bar 1 cm. C, Epifluorescence images of leaf blades of Col and phot1phot2 plants expressing DR5:VENUS grown for 2 weeks and transferred for 1 week to WL, RL, and RBL. For each leaf, images were taken on the AD and AB side. Scale bar 1 cm. D, Quantification the VENUS fluorescence in epifluorescence images of whole blades. For each leaf, images were taken on the AD and AB side, DR5:VENUS fluorescence was quantified and the ratio between fluorescence in each side was calculated. Each bar represents mean ± se of 10–16 leaves. Different letters represent significant differences among means (P < 0.05) in an ANOVA followed by Tukey’s test.
