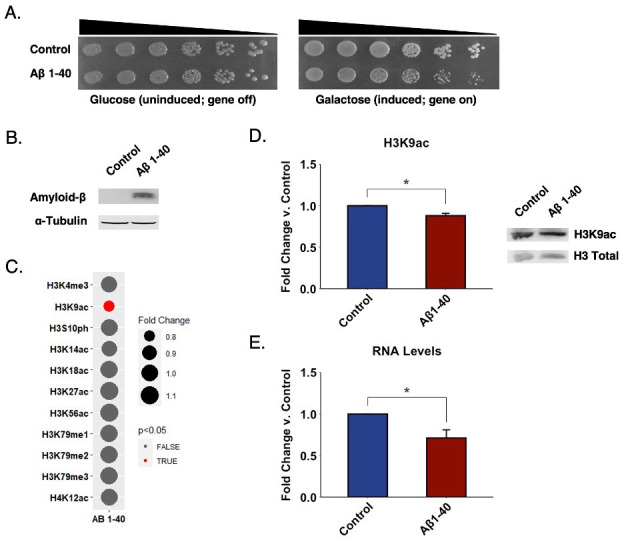
Figure 1. Aβ 1-40 overexpression in yeast is accompanied by changes in H3K9ac levels.

(A) Strains overexpressing Aβ 1-40 display mild growth suppression. Serial dilution growth assays for strains overexpressing Aβ 1-40 or a vector control grown in glucose or galactose-supplemented selective solid media. Black triangles indicate the relative concentrations of cells in the corresponding spots. (B) Expression of Aβ 1-40 verified by Western blotting. (C) Histone PTM levels are mostly unaffected by Aβ 1-40 overexpression in yeast. The bubble size represents the degree of change in the relative abundance of a histone modification. A smaller bubble represents a decrease in the levels of the modification, while a larger bubble represents an increase. The color scale depicts p-values derived from statistical analysis of Western blotting experiments. Red indicates changes with a p-value below 0.05, while gray indicates a p-value above 0.05. p-values were calculated using a two-tailed t test with Welch’s modification. (D) Acetylation on lysine 9 of Histone H3 is modestly decreased in the context of Aβ 1-40 overexpression. Graph displays the mean fold change in modification levels for Aβ 1-40 compared to vector control. Representative immunoblot shows the levels of lysine acetylation in Aβ 1-40 overexpression. Error bars indicate +SD (n=3). (*) p < 0.05. (E) Total RNA levels are decreased in Aβ 1-40 compared to vector control. Graph displays the mean fold change in total RNA levels for Aβ 1-40. Error bars indicate +SD (n=3). (*) p < 0.05.
