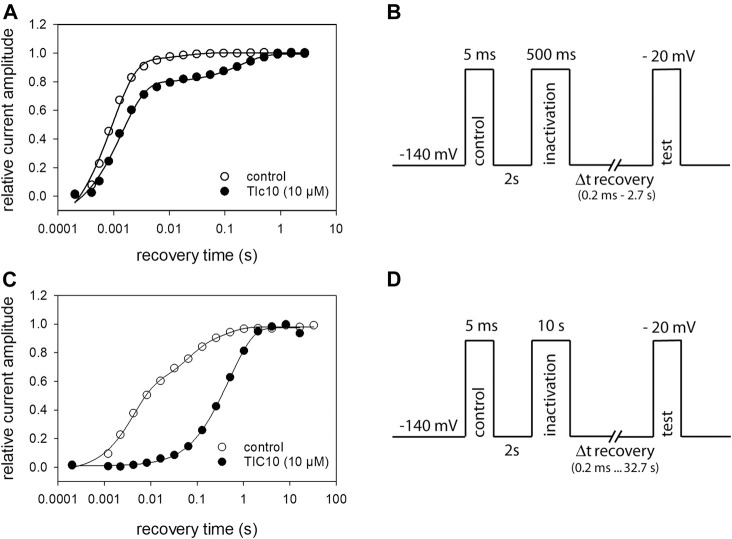
FIGURE 10.
Recovery from inactivation. (A) Recovery from fast inactivation. The relative amount of available channels versus the recovery time at −140 mV is illustrated. Solid lines represent fits with two exponential functions according to Eq. 11. (B) Experimental scheme. After an initial control pulse, inactivation was performed at −20 mV for 500 ms. The test-pulse was applied after a varying time of recovery. For evaluation, current amplitudes of the test-pulses were related to their controls. Interval between individual runs was 10 s and TIC10 was applied at 10 µM. (C) Recovery from slow inactivation. In case of control, three exponentials were required to describe the time course of recovery; in the presence of TIC10, two exponentials were sufficient. (D) Experimental scheme for recovery from slow inactivation. Otherwise, identical protocol as in (A) but with the inactivation time set to 10 s and recovery time prolonged up to 32.8 s.

