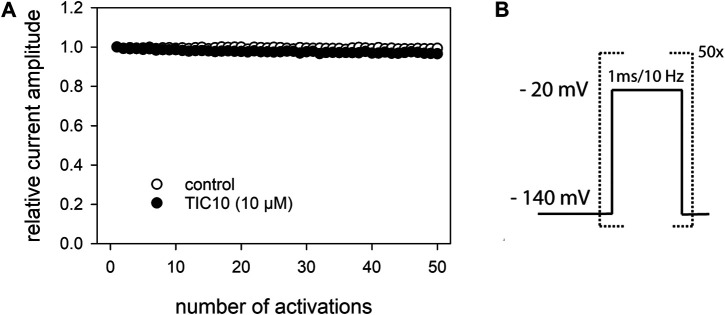
FIGURE 11.
Analysis for use-dependence. (A) Illustrated is the relative current amplitude versus the number of channel activations. (B) Experimental scheme. Channel activations were carried out by brief pulses (1 ms) to −20 mV at a frequency of 10 Hz in the absence and presence of TIC10 (10 µM). Current amplitudes minimally decline under control from the first to the last activation (50th pulse) to 99.5 ± 0.6% and in the presence of TIC10 (10 µM) to 95.7 ± 1.6%. TIC10 was preincubated for 20 s before starting the high frequency activation.

