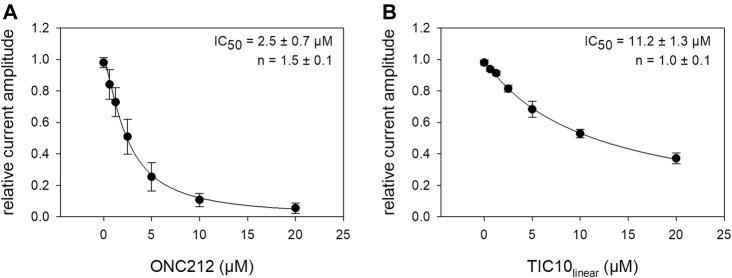
FIGURE 14.
Interaction of imipridone derivatives with the inactivated state. The graphs show relative current amplitudes upon channel activations in the presence of different concentrations of imipridone derivates after a prolonged inactivation (20 s). Experimental scheme as illustrated by Figure 8B. (A). Data for ONC212, revealed a half-maximal inhibition at 2.5 ± 0.7 µM. (B) Data for TIC10linear with a half-maximal effect at 11.2 ± 1.3 µM.

