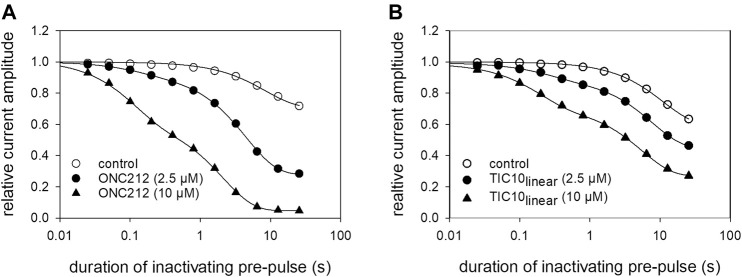
FIGURE 15.
Time-dependent interaction of imipridone derivatives. The graph illustrates relative current amplitudes in the absence and presence of different concentrations of (A) ONC212 and (B) TIC10linear versus the duration of the inactivating pre-pulse to −20 mV. Solid lines describe individual time courses obtained in the absence and presence of TIC10 using double exponential functions for data fitting. Experimental scheme as illustrated by Figure 7D. Details of evaluation are given by Table 2.

