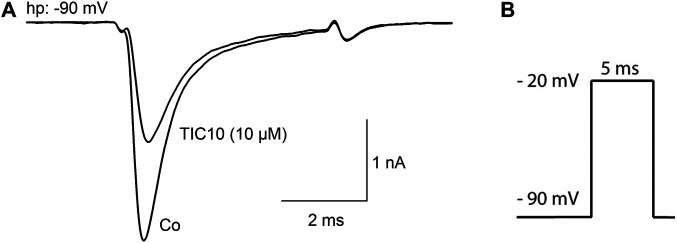
FIGURE 2.
Inhibition of hNav1.5 channels by TIC10. (A) Representative current traces obtained for control and in the presence of 10 µM TIC10. A similar outcome was obtained from four other cells. (B) Experimental scheme. Channel activations were carried out from a holding potential of −90 mV by depolarization to −20 mV for 5 ms.

