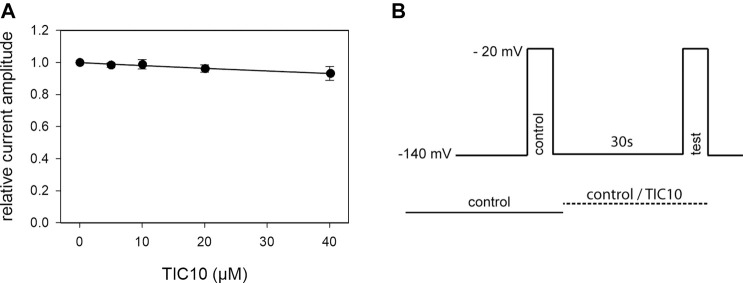
FIGURE 3.
Block of resting hNav1.5 channels. (A) Illustrated are relative current amplitudes in relation to the applied concentration of TIC10. Data points were fitted according to Eq. 1. Note, even at the highest concentration of TIC10 (40 µM), the inhibitory effect is far from being half-maximal. Thus, the calculated affinity (Kr = 600.4 ± 290.8 µM) has to be considered as a rough estimation. (B) Experimental scheme. Channel activations in the absence (control) and presence (test) of different concentrations of TIC10 were carried out from a holding potential of −140 mV. Current amplitudes obtained for the test-pulses were related to their controls and plotted against the concentration of TIC10.

