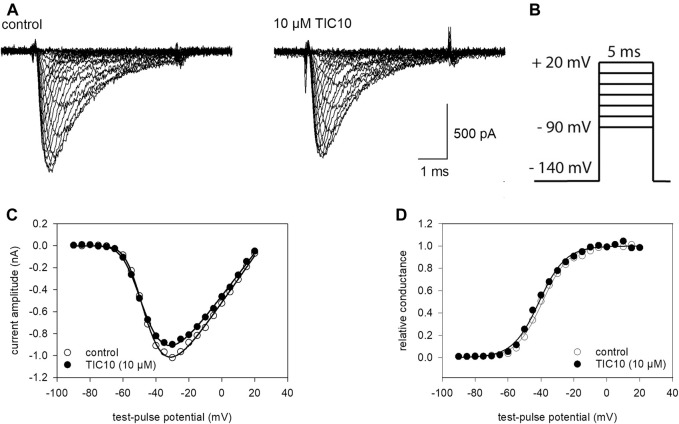
FIGURE 4.
Voltage-dependence of activation. (A) Original traces obtained from channel activations in the absence (left) and presence of 10 µM TIC10 (right). (B) Experimental scheme: cells were clamped at a holding potential of −140 mV from which sodium currents were evoked by 5 ms test-pulses to potentials ranging from −90 to +20 mV (increment 5 mV). (C) Plots of maximal current amplitudes in the absence (open circles) and presence of 10 µM TIC10 (filled circles) versus the test potential. (D) Voltage-dependence of channel activation. Data from C were converted to conductance, normalized, and plotted versus the test-pulse potential. Half-maximal activation occurred at −43.1 ± 2.9 mV (k: 7.2 ± 0.6 mV) and −44.8 ± 2.8 mV (k: 7.9 ± 0.8 mV) for control and in the presence of 10 µM TIC10, respectively.

