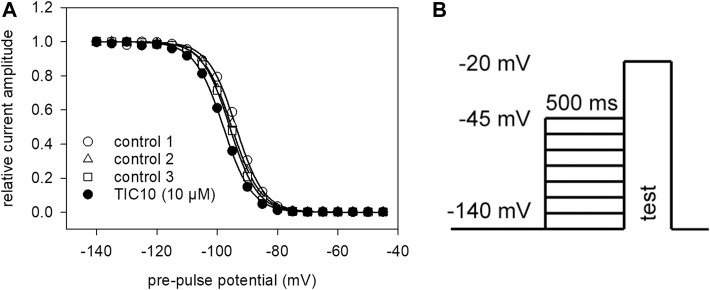
FIGURE 5.
Voltage-dependence of fast inactivation. (A) Data of normalized transient currents in the absence (open symbols) and presence of TIC10 (filled circles) are plotted against the pre-pulse potential. Solid lines represent fits according to Eq. 4. Respecting the drug independent shift, inactivation midpoints shifted in the presence of 10 µM TIC10 by 1.2 ± 1.4 mV to more negative potentials. (B) Experimental scheme. Voltage-dependence of fast inactivation was determined by measuring sodium currents elicited by 5 ms depolarizations to −20 mV after conditioning pre-pulses for 500 ms to different potentials (range −140 to −45 mV).

