
FIGURE 6.
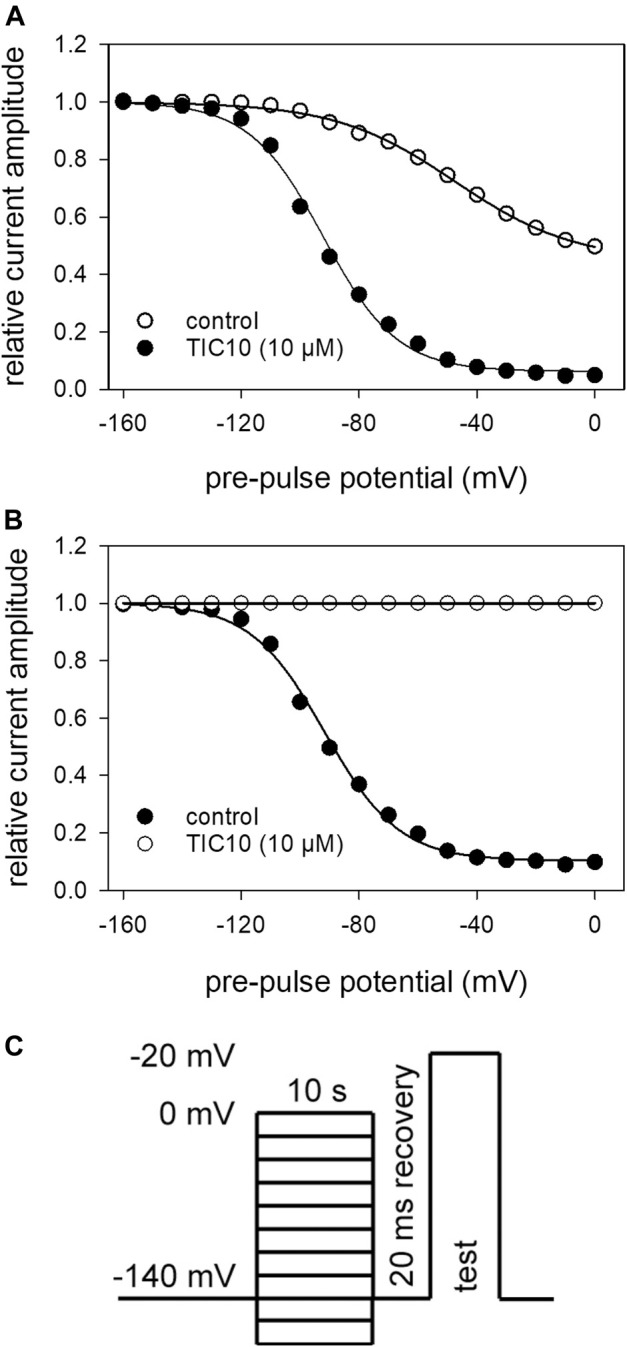
Voltage-dependence of slow inactivation. (A) Relative current amplitudes in dependence of the pre-pulse potential. Solid lines are fits according to Eq. 5 for control (open circles) and TIC10 (10 μM, filled circles). (B) Normalized data with resepct to control. (C) Experimental scheme. Activations to −20 mV were elicited after long-lasting (10 s) conditioning pre-pulses to different potentials (range: −160 to 0 mV; increment 10 mV) and a short (20 ms) recovery period at −140 mV immediately before the test-pulse.