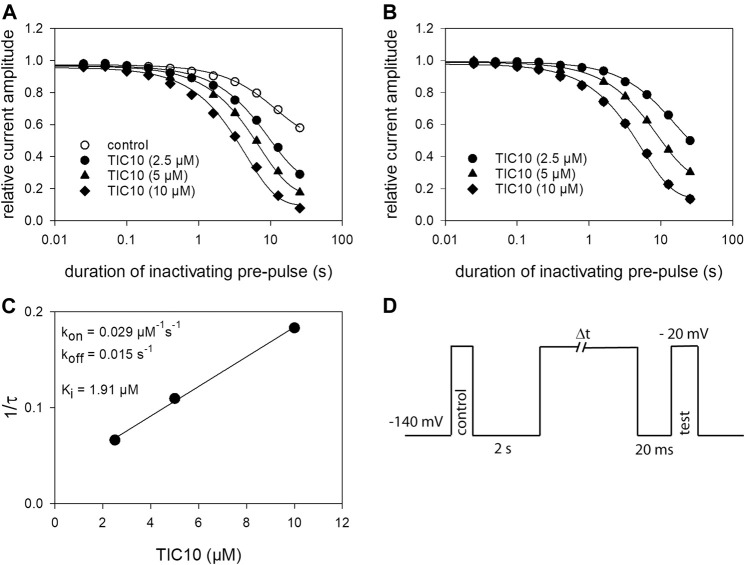
FIGURE 7.
Time-dependent interaction. (A) The graph illustrates relative current amplitudes in the absence and presence of TIC 10 versus the duration of an inactivating pre-pulse to −20 mV. Solid lines describe individual time courses obtained in the absence and presence of TIC10 using single exponential functions for data fitting. (B) Data from A, normalized with respect to control. (C) Plot of the inverse of the time constants estimated from the data as illustrated in B versus the concentration of TIC10. Kon and koff values were taken from the slope and the y-intercept of the linear regression, respectively. The affinity for the inactivated state (Ki) was calculated according to Eq. 10 to be 1.91 µM in this experiment. Altogether a Ki of von 1.86 ± 0.7 µM resulted. (D) Experimental scheme. Starting from a holding potential of −140 mV, first a control pulse to −20 s was executed. Thereafter, ample time (2 s) was given to allow for full recovery before channels were inactivated for a variable duration at −20 mV. The test-pulse was carried out after a short recovery at −140 mV. For evaluation, test-pulse amplitudes were related to their controls.

