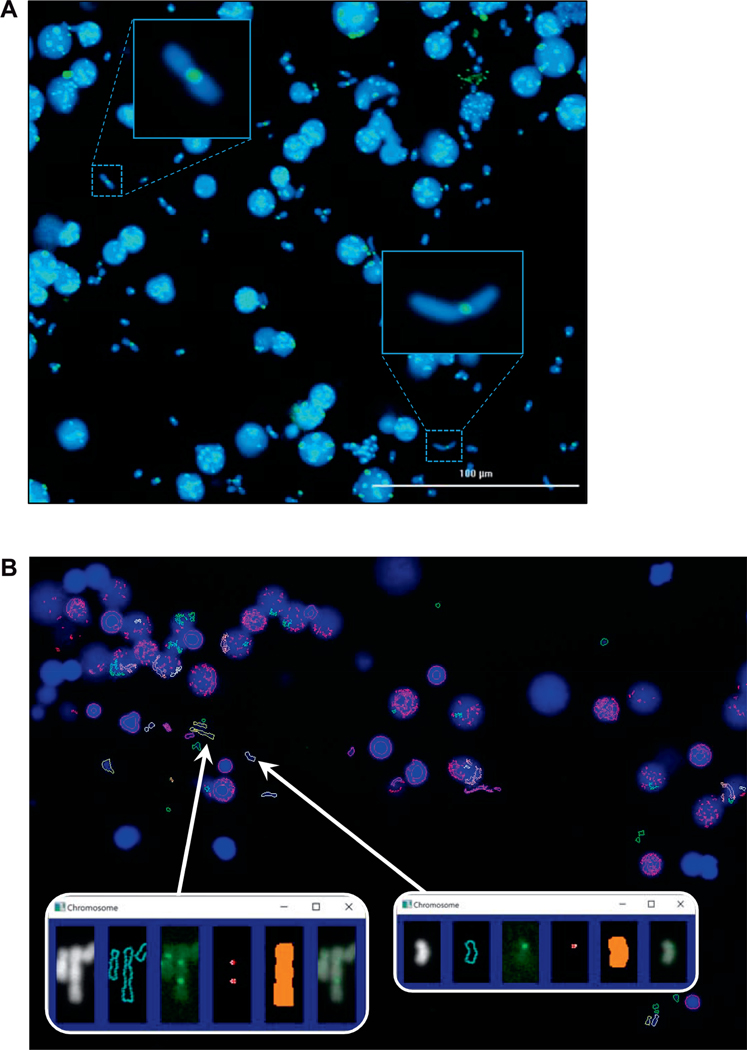
FIG. 2.
Automated detection of dicentrics in the RABiT-II system. Panel A: Chromosomes released from mitotic cells (30 μl of whole blood), 0 Gy sample. Panel B: Output from the image analysis software FluorQuantDic version 3.3. Large blue objects are intact nuclei. White outlines correspond to identified monocentric chromosomes. Red outlines are objects which are either too big or too small to be scored as chromosomes. Green objects are too round to be chromosomes. Yellow objects are identified dicentric chromosomes. Inserts are identified dicentric (left) and monocentric (right) chromosomes. Panels from left to right: chromosome image (DAPI); the identified chromosome outline; centromere signal (FITC); identified centromeres; the mask for selecting which centromeres are associated with the chromosome; a merged DAPI/FITC image.

