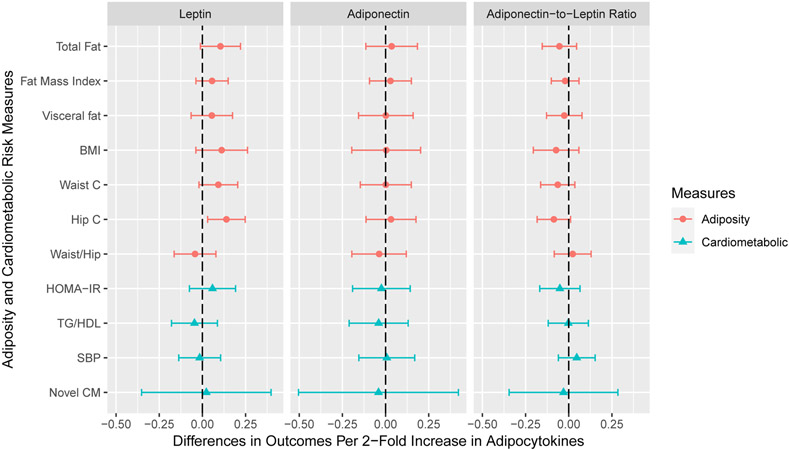
Figure 1. Adjusted Differences in Adiposity and Cardiometabolic Risk Outcome Standardized Z-Scores with 1-Unit Increase in Log2-Transformed Cord Serum Adipocytokine Concentrations: The HOME Study.
BMI: body mass index; waist c: waist circumference; hip c: hip circumference; waist/hip: waist to hip ratio; HOMA-IR: Homeostatic Model Assessment of Insulin Resistance; TG/HDL: triglycerides to high density lipoprotein ratio; SBP: systolic blood pressure; novel CM: novel cardiometabolic risk score.
All models adjusted for maternal age, maternal education, maternal pre-pregnancy BMI, gestational smoking, parity; child age, sex, race, and length of breastfeeding.
All outcomes were sex- and age-standardized z-scores. Whole body fat mass, visceral fat area, waist circumference, HOMA-IR, and triglycerides to HDL ratio were not normally distributed, and thus were log2-transformed before standardization.

