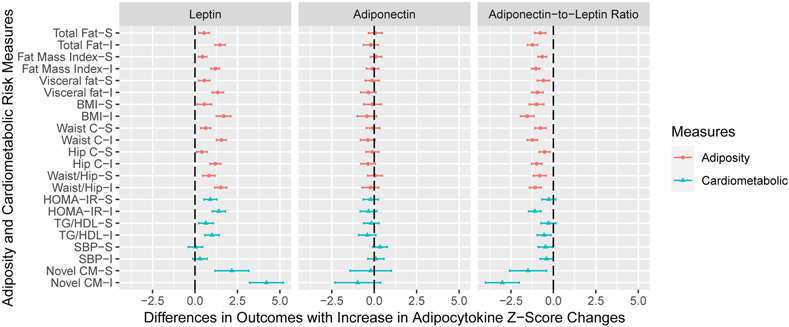
Figure 4. Adjusted Differences in Adiposity and Cardiometabolic Risk Outcome Standardized Z-Scores with 1- or 2- Tercile Increase in Adipocytokine Standardized Z-Score Changes (Age 12 Year – Cord), additionally Adjusted for Adipocytokine Concentrations at Birth.
Reference group is the decreasing group (Tercile 1). -S: stable group; -I: increasing group.
Leptin: Tercile 1 (Decreasing) −6.24 SD to −0.32 SD; Tercile 2 (Stable) −0.32 SD to 0.26 SD; Tercile 3 (Increasing) 0.26 SD to 3.73 SD.
Adiponectin: Tercile 1 (Decreasing) −4.38 SD to −0.40 SD; Tercile 2 (Stable) −0.40 SD to 0.27 SD; Tercile 3 (Increasing) 0.27 SD to 3.75 SD.
Adiponectin-to-leptin ratio: Tercile 1 (Decreasing) −7.68 SD to −0.30 SD; Tercile 2 (Stable) −0.30 SD to 0 SD; Tercile 3 (Increasing) 0 SD to 3.96 SD.
Fat: whole body fat mass; FMI: whole body fat mass index; Visc: visceral fat area; BMI: body mass index; W: waist circumference; H: hip circumference; W/H: waist to hip ratio; HOMA-IR: Homeostatic Model Assessment of Insulin Resistance; TG/HDL: triglycerides to high density lipoprotein ratio; SBP: systolic blood pressure; Novel: novel cardiometabolic risk score.
All models adjusted for maternal age, maternal education, maternal pre-pregnancy BMI, gestational smoking, parity; child age, sex, race, and length of breastfeeding.
All outcomes were sex- and age-standardized z-scores. Whole body fat mass, visceral fat area, waist circumference, HOMA-IR, and triglycerides to HDL ratio were not normally distributed, and thus were log2-transformed before standardization.

