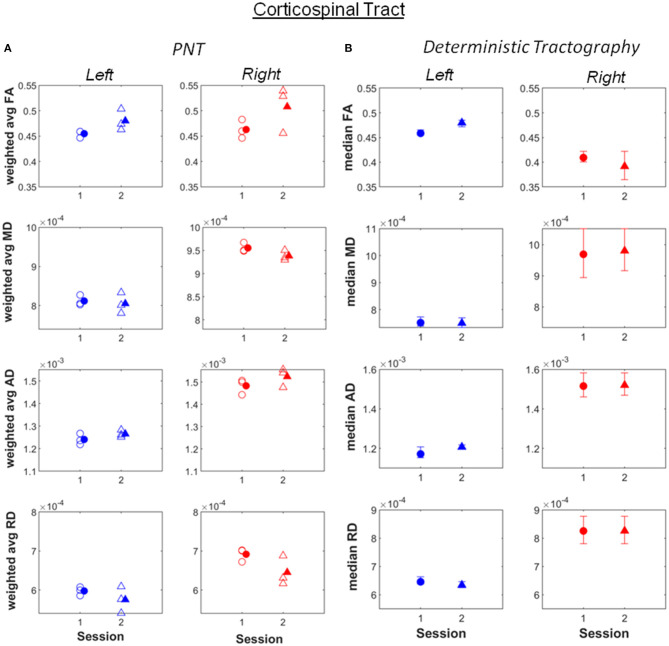
Figure 2.
(A) Weighted average values of FA, MD, AD and RD computed along the best matching (relative to reference model tract) corticospinal tract, before (session 1) and after (session 2) the piano training. (B) Median values of FA, MD, AD and RD computed along the tract, also for before (session 1) and after (session 2) the training. Error bars illustrate 95% confidence intervals. L, left hemisphere; R, right hemisphere.

