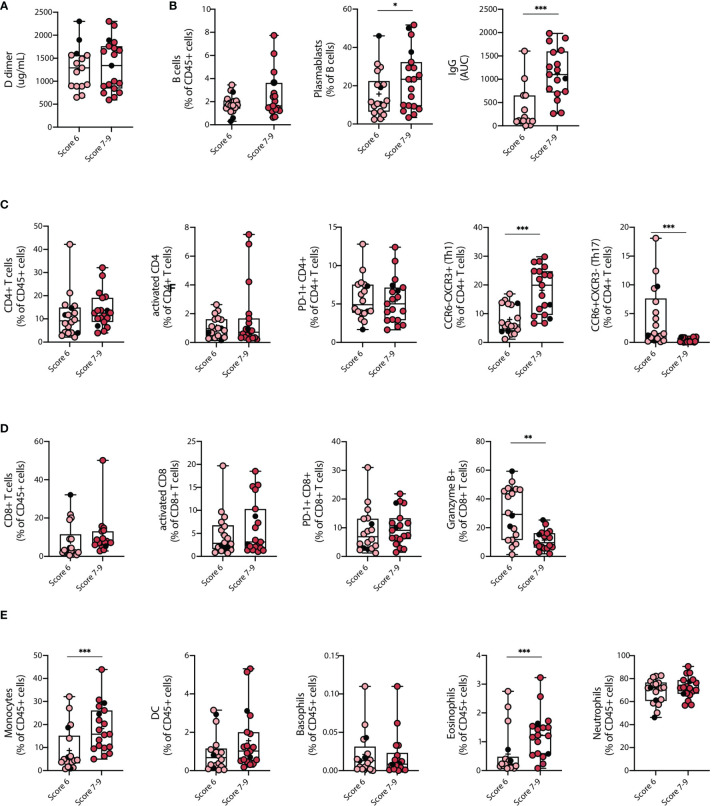
Figure 3.
Clinical parameters and differences in the immune cell landscape between Severe COVID-19 patients with different severity scores. Changes among key clinical parameters and main immune cell populations in peripheral blood of COVID-19 patients with severe SARS-CoV-2 infection (COVID-S) were assessed within patients with different severity scores. (A) D-dimer plasma concentrations. (B) Humoral response of COVID-S patients with different severity scores. B cell frequency on CD45+ cells, plasmablasts percentage within the B cell population and Immunoglobulin G (IgG) concentration in plasma. (C, D) Cellular immune response in COVID-S patients with different severity scores. (C) CD4+ T cell frequency within the CD45+ compartment, activated and PD-1+ CD4+ T cell populations and Th1 equivalents percentage of CD4+ T cells. (D) CD8+ T cell frequency within the CD45+ compartment, activated and PD-1+ CD8+ T cell populations and granzyme B+ CD8+ T cells. (E) Myeloid cell and granulocyte compartment analysis from peripheral blood of COVID-19 severe patients classified by disease score. Graphs show frequency of monocytes, dendritic cells (DC), basophils, eosinophils and neutrophils within CD45+ cells. Score 6 = 18; Score 7-9 = 19. Black circles indicate deceased patients. Differences between groups were calculated using Mann Whitney tests (*p = 0,05; **p = 0,01; ***p = 0,001). Data mean is shown by a + on each box plot.

