Figure 4.
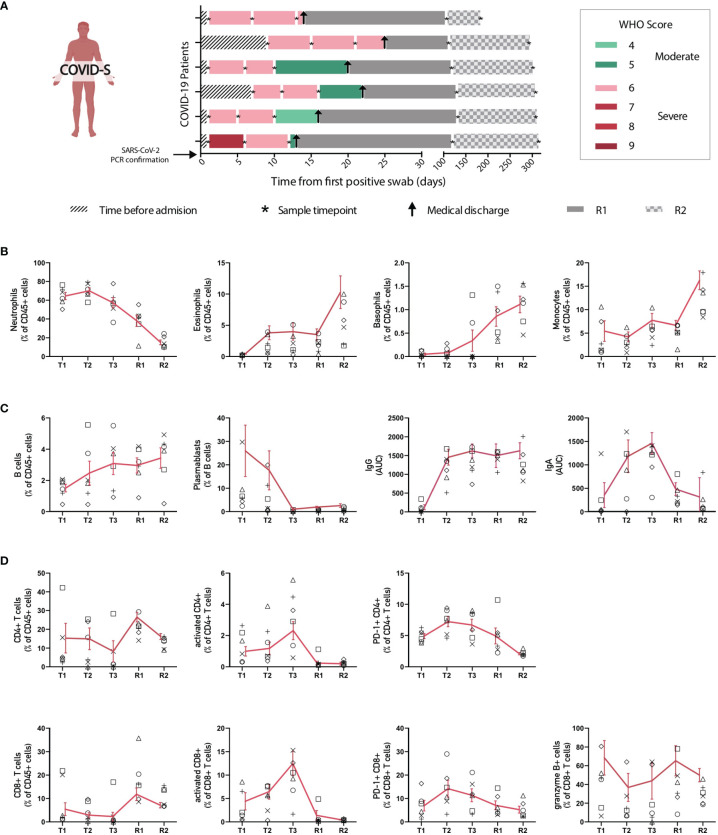
Longitudinal analysis of immune populations in patients with severe SARS-CoV-2 infection. Main immune cell populations affected in severe COVID-19 patients were analyzed over time at different intervals until patient recovery. (A) Follow-up diagram of patients with severe COVID-19 disease. Peripheral blood samples from 6 patients with severe SARS-CoV-2 infection were collected at 3 different time points after ICU admission and SARS-CoV-2 PCR confirmation (T1, T2 and T3), plus two additional samples after recovery and clinical discharge (R1 and R2). The first sample (T1) was taken upon ICU admission and positive SARS-CoV-2 PCR, while second (T2) and third (T3) blood samples were taken 5-7 and 9-13 days after, correspondingly. R1 samples for follow-ups were taken once the patient had recovered and been released from the hospital, between 1 and 3 months after ICU admission. R2 samples were taken 6 months after patient recovery and clinical discharge. (B) Changes in frequency of innate immune populations during disease evolution and recovery. (C, D) Changes of adaptive immune components throughout time. Graphs show individual data for each patient and the mean ± SEM per group connected by a red solid line.

