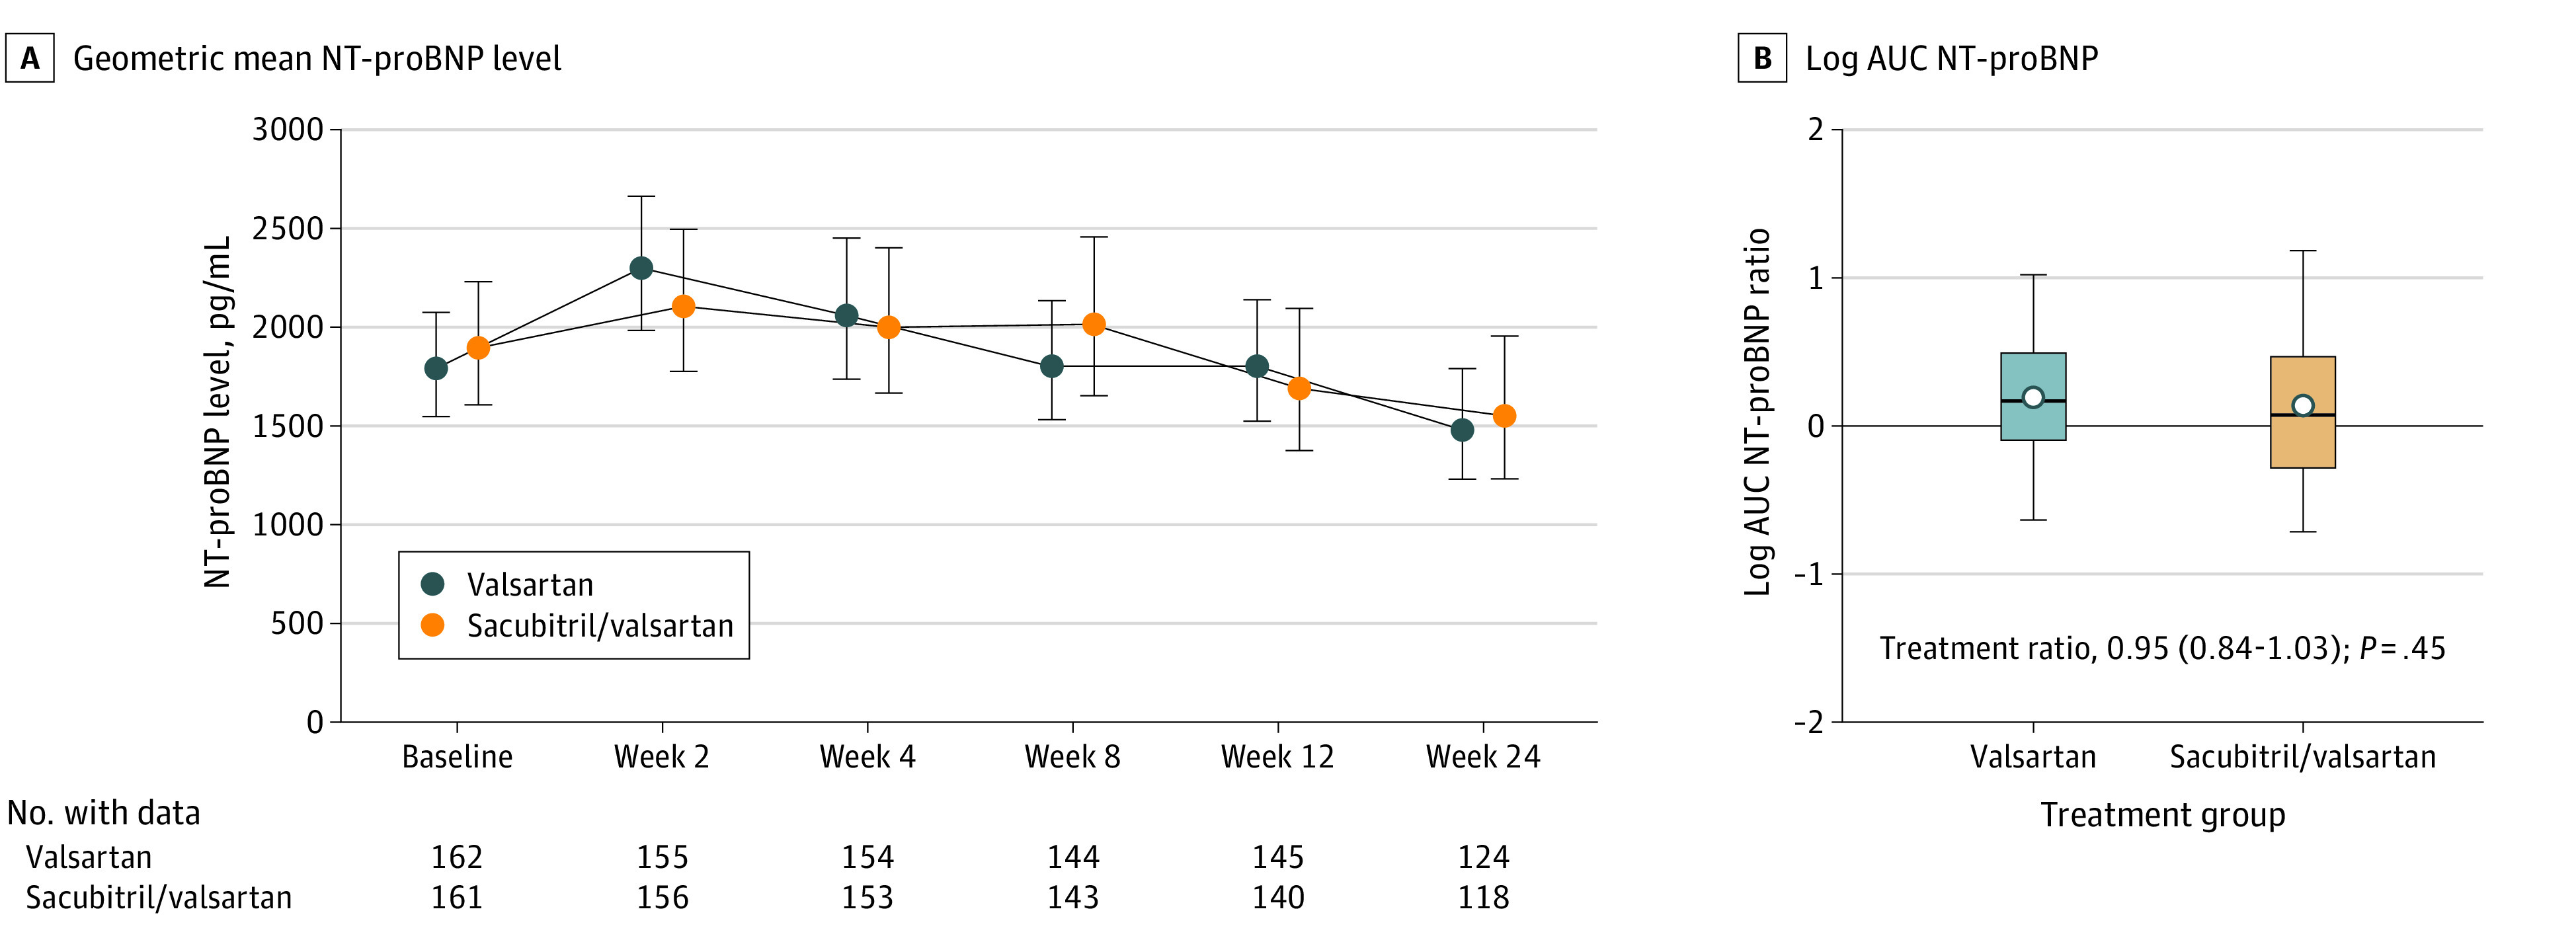
Figure 2. Change in N-Terminal Pro–Brain Natriuretic Peptide (NT-proBNP) Levels.

A, The geometric mean NT-proBNP levels remained above baseline values in the sacubitril/valsartan and valsartan treatments arms through 8 weeks of therapy, and then decreased numerically in both treatment arms by 24 weeks. B, The box plots for the log-transformed area under the curve (AUC) (primary end point) were formed by the 25th and 75th percentiles and the line within the box is the median; the error bars indicate the 95% CIs and the data markers indicate the means. Compared with baseline levels, the median AUC of NT-proBNP was 1.19 (IQR, 0.91-1.64) for the valsartan treatment arm and 1.08 (IQR, 0.75-1.60) for the sacubitril/valsartan treatment arm. The estimated ratio of change was 0.95 (95% CI, 0.84-1.08; P = .45) for sacubitril/valsartan vs valsartan. The solid horizontal line reflects the value for no change in NT-proBNP level from baseline. Values above the line indicate an increase in the AUC from baseline, whereas values below the line indicate a decrease in the AUC from baseline. The non–log-transformed data for this figure are presented in eFigure 3 in Supplement 2.
