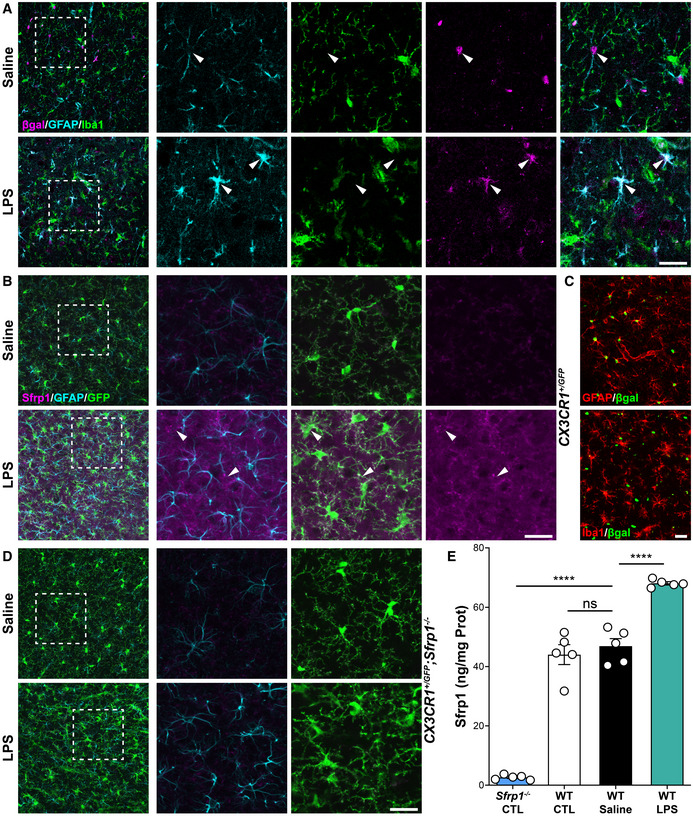
Figure 1. Astrocytes upregulate SFRP1 expression upon LPS stimulation.

-
A–DConfocal image analysis of cryostat sections from adult CX3CR1 +/ GFP ; Sfrp1 +/ βgal (A, B); Sfrp1 +/ βgal (C) and CX3CR1 +/ GFP ;Sfrp1 −/− (D) and mouse brains three days after intracortical infusion of saline or LPS. Sections were immunostained for βgal (magenta, green in C) and Iba1 (green in A; red in C) or Sfrp1 (magenta) and GFP (green, B and D), and GFAP (cyan in A, B, D, red in C). Arrowheads indicate βgal/GFAP (A) and Sfrp1/GFP co‐localization (B). No Sfrp1 protein is detected in the null mice independently of the treatment (two bottom lines). Scale bar: 25 μm.
-
EELISA determination of Sfrp1 levels in brain extracts from 3‐month‐old wt and Sfrp1 −/− mice. WT mice were injected either with saline or with LPS. Three days after injection, the region around the injected side (10 mm3 cortical cube) was isolated and SFRP1 content compared with that present in similar region of non‐injected or Sfrp1 −/− mice used as negative control (n = 5 mice for each group). Error bars represent standard error. Statistical significance: ns P > 0.5 ****P < 0.0001; one‐way ANOVA followed by the Bonferroni multiple comparisons test.
