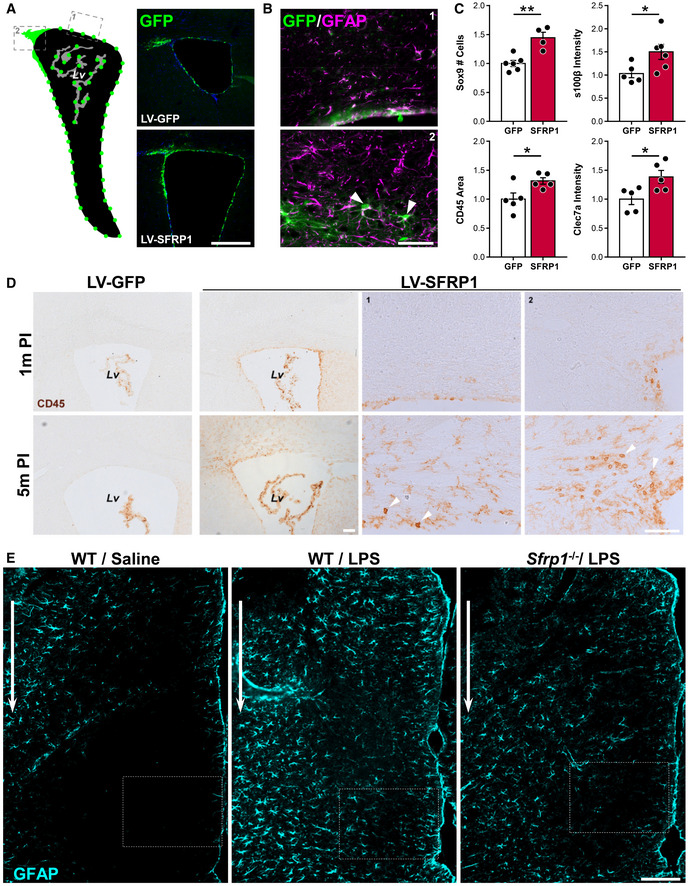
Figure EV1. SFRP1 enhances glial cell activation.

- On the left, diagram of the observed GFP distribution (green dots) after lentiviral (LV) particles' delivery into the lateral ventricle (Lv). The dashed boxes represent areas shown in (B) and (D), 1 points to the wall of the lateral ventricle, and 2 to the Rostral Migratory Stream. Images on the right show examples of immunostaining against GFP protein (GFP signal was no longer visible, unless detected with immunohistochemistry) in the Lv of brains transduced with LV‐IRES‐Gfp or LV‐Sfrp1‐IRES‐Gfp 5 months (m) post‐infusion. Scale bar: 100 μm.
- Double immunostaining against GFP (green) and GFAP (magenta) of brains transduced with LV‐Sfrp1‐IRES‐Gfp, indicating that transduced cells include astrocytes. Arrowheads indicate GFP+ astrocytes. Scale bar: 50 μm.
- The graphs show the number of Sox9 immunopositive cells, S100β and Cleac7a immune intensity level and CD45 immunopositive area in LV‐Sfrp1‐IRES‐Gfp‐infected brains normalized against the mean value obtained in LV‐IRES‐Gfp‐infected control brains. Dots represent the mean value obtained by the analysis of 6 sections for each biological replica (n = 4–6, mice per group). Error bars represent standard error. Statistical significance: *P < 0.05; **P < 0.01 by two‐sided Student’s t‐test.
- Coronal sections from LV‐IRES‐Gfp‐ or LV‐Sfrp1‐IRES‐Gfp‐infected brains 1 or 5 months (m) post‐infusion (PI). Sections were immunostained for CD45. Arrowheads indicate CD45hi‐positive macrophages or lymphocytes infiltrated in the parenchyma after prolonged LV‐Sfrp1‐IRES‐Gfp infection. High‐power images 1 and 2 were taken from the regions indicated with grey dotted lines in A. Scale bar: 50 μm.
- Coronal sections from wt and Sfrp1 −/− mouse brains three days after infusion of saline or LPS, immunostained for GFAP. The white arrows indicate the injection site; the area boxed with white lines is represented at high power in Fig 2. Scale bar: 100 μm.
