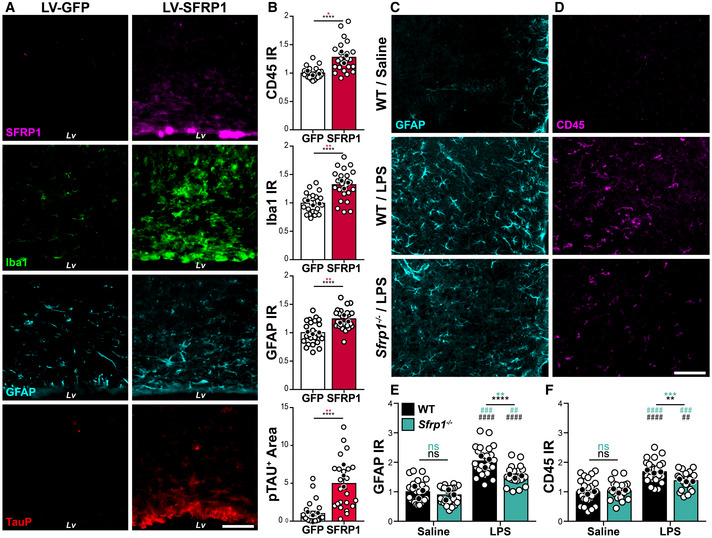
Figure 2. SFRP1 is sufficient and required to enhance glial cell activation upon LPS treatment.

-
ACoronal cryostat sections of LV‐IRES‐Gfp‐ or LV‐Sfrp1‐IRES‐Gfp‐infected brains 1 month post‐infusion immunostained for SFRP1 (magenta), Iba1 (green), GFAP (cyan) or TauP (red). Lv, lateral ventricle. Scale bar: 100 μm.
-
BThe graph shows the normalized level of GFAP, Iba1 and CD45 immunoreactivity (IR) and the area occupied by TauP signal (n = 24 acquisitions, white dots; N = 3 mice, black dots, for each group), normalized to LV‐IRES‐Gfp‐infected brains. Error bars represent standard error. Statistical significance: *P < 0.05; **P < 0.01; ****P < 0.0001 by two‐sided Student’s t‐test.
-
C, DCoronal sections from wt and Sfrp1 −/− mouse brains three days after infusion of saline or LPS immunostained for GFAP (cyan, C) or CD45 (magenta, D). The images are high‐power views of the somatosensory cortex (lower power view in Fig EV1D). Scale bar: 60 μm.
-
E, FThe graphs show the normalized levels of immunoreactivity (IR) for GFAP (E) and CD45 (F, P = 0.006) present in cortical sections (n = 24 acquisitions white dots; from N = 3 animals, black dots, per group) from wt and Sfrp1 −/− animals infused with saline or LPS. Bars represent standard error. Statistical significance calculated per biological replicas is indicated in green and that based on number of acquisitions in black. ** or ## P < 0.01; *** or ### P < 0.001; and **** or #### P < 0.0001 by two‐way ANOVA followed by Bonferroni's multiple comparisons test. * and # indicate significance between genotypes and treatments, respectively.
