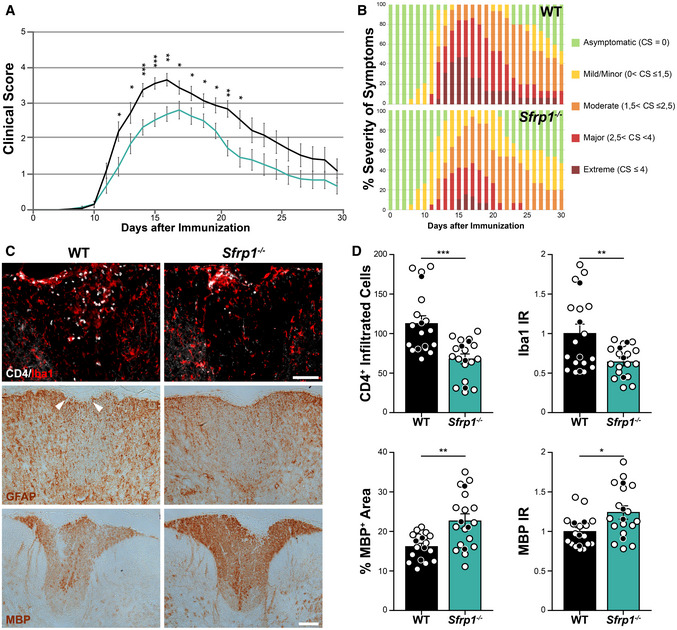
Figure 3. Sfrp1 −/− mice develop a milder form of EAE.

-
A, BTime course analysis and severity of the symptoms in wt and Sfrp1 −/− mice after EAE induction. In A, means are depicted with black (wt, n = 19) and cyan (Sfrp1 −/−, n = 19) lines. In B, data are expressed as % of the total number of analysed animals (n = 19 per genotype). In (A), error bars represent standard error.
-
CWt and Sfrp1 −/− mice immunized with MOG and sacrificed 16 days post‐immunization. Cryostat sections of the thoracic spinal cords were stained with antibodies against CD4, Iba1, GFAP and MBP. Images show the region dorsal fasciculus. White arrowheads point to the disruption of the pia surface in wt. Scale bar: 100μm.
-
DQuantification of CD4+ infiltrated lymphocytes, Iba1‐normalized immunoreactivity, MBP‐normalized immunoreactivity and MBP immune‐reactive area in the dorsal fasciculus of spinal cord sections from wt and Sfrp1 −/− mice 16 days after immunization (n = 16 acquisitions, white dots; from N = 4 animals, black dots, per genotype). Error bars represent standard error. Statistic refers to number of acquisitions.
Data information: *P < 0.05, **P < 0.01 and ***P < 0.001 by the Kolmogorov–Smirnov test followed by the Mann–Whitney U nonparametric test comparing mice of the same day after immunization (A) or two‐sided Student’s t‐test (D).
