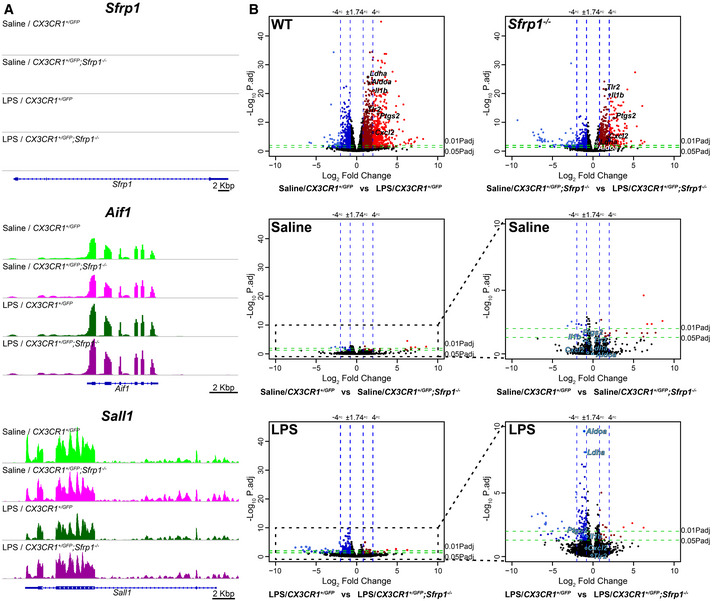
Figure EV3. Non‐cell‐autonomous effect of Sfrp1 on microglial response to LPS.

- Integrative Genomics Viewer transcription profile of Sfrp1 and the microglial specific genes Aif1 and Sall1 in microglial cells isolated from saline and LPS treatment of CX3CR1GFP /+ and CX3CR1GFP /+ ;Sfrp1 −/− mice. Scale bar: 2 Kbp.
- Volcano plots of differential gene expression from CX3CR1GFP /+ or CX3CR1GFP /+ ;Sfrp1 −/− microglial cell in response to saline or LPS. Data are represented as log2 fold change vs ‐Log10 adjusted P‐value by the Wald test corrected for multiple comparisons by the Benjamini and Hochberg method. Note that expression variations associated with genotype in saline‐treated animals are minimal. The effect of the genotype is evident only after LPS treatment. Genes with an expression change higher than 75% and an adjusted P‐value < 0.05 are highlighted in dark red (+FC) and dark blue (−FC). Genes with an expression change higher than 400% and an adjusted P‐value < 0.01 are highlighted in light red (+FC) and light blue (−FC).
