-
A
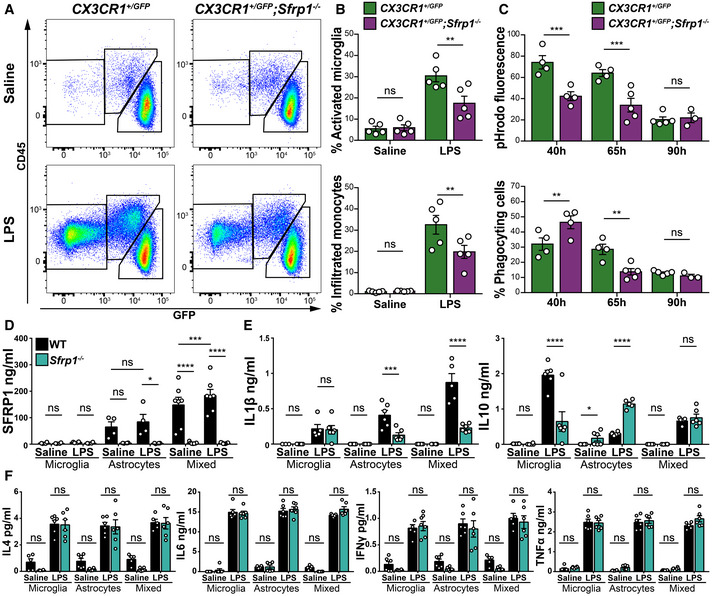
Representative cytometric plots of CD11b+ populations present in the cortex of CX3CR1GFP
/+ or CX3CR1GFP
/+
;Sfrp1
−/− mice 3 days after saline or LPS intraventricular infusion. Gating was set for isolating the following myeloid cell populations: CD11b+; CD45lo; GFP+ surveying microglia, CD11b+; CD45+; GFP+ activated microglia and CD11b+;CD45+;GFP‐ infiltrated monocytes.
-
B
Quantification of the percentage of activated microglia and infiltrated monocyte present in Sfrp1
−/− and controls brains 3 days after infusion of saline or LPS (n = 5 animals per genotype and condition). Error bars represent standard error. Statistical significance: **P < 0.01 by two‐way ANOVA followed by Bonferroni's multiple comparisons test.
-
C
Quantification of the total fluorescence from phagocytized pHrodo‐labelled E. coli BioParticles and percentage of phagocyting cells in the CD11b+;GFP+ microglial population (n = 3–5 animals per genotype and condition). Error bars represent standard error. Statistical significance: **P < 0.01 and ***P < 0.001 by two‐way ANOVA followed by Bonferroni' s multiple comparisons test.
-
D
ELISA determination of SFRP1 levels present in the media of microglia (n = 4 cultures per genotype), astrocytes (n = 4 cultures per genotype) or mixed astrocytes and microglial (2:1, n = 7 cultures per genotype) cultures derived from wt or Sfrp1
−/− pups exposed for 24 h to saline or LPS (1 μg/ml). Error bars represent standard error. Statistical significance: *P < 0.05, ***P < 0.001 and ****P < 0.0001 by one‐way ANOVA followed by the Bonferroni test.
-
E, F
Secretory profile of cytokines present in the medium of microglia, astrocytes or mixed astrocytes and microglial (2:1) culture as above (n = 5–6 cultures type—microglia, astrocytes or mixed cultures—and genotype). The content of IFN‐γ, TNF‐α, IL‐1β, IL‐4, IL‐6 and IL‐10 was determined by multiplex ELISA. Values are represented in absolute concentration. Error bars represent standard error. Statistical significance: ns, P > 0.05, *P < 0.05, ***P < 0.001 and ****P < 0.0001 by two‐way ANOVA followed by Bonferroni's multiple comparisons test.

