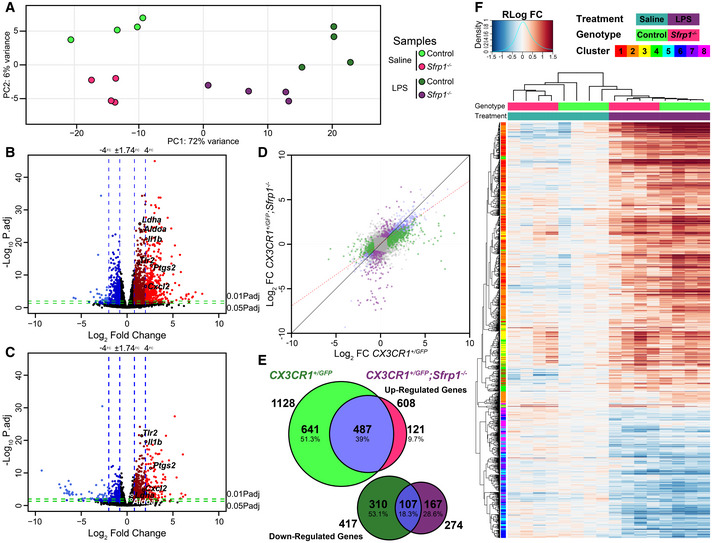
Figure 5. SFRP1 enhances microglial cells’ transcriptional response to LPS treatment.

-
APrincipal component analysis with the 1,000 most variable genes from microglial cells isolated from CX3CR1GFP /+ and CX3CR1GFP /+ ;Sfrp1 −/− mouse brains three days after saline or LPS intracerebroventricular infusion. The analysis depicts sample clusterization by genotype and treatment.
-
B, CVolcano plots of differential gene expression from CX3CR1GFP /+ (B) or CX3CR1GFP /+ ;Sfrp1 −/− (C) microglial cell in response to LPS. Data are represented as log2 fold change vs ‐Log10 adjusted P‐value by the Wald test corrected for multiple comparisons by the Benjamini and Hochberg method. Blue vertical lines represent an increase of 75 and 400% in the expression levels, respectively. Green horizontal lines represent a 0.05 or 0.01 adjusted P‐value of statistical significance, respectively. Genes with an expression change higher than 75% and an adjusted P‐value lower than 0.05 are highlighted in dark red (+FC) and dark blue (−FC). Genes with an expression change higher than 400% and an adjusted P‐value lower than 0.01 are coloured in light red (+FC) and light blue (−FC).
-
DScatterplot of differentially expressed genes in CX3CR1GFP /+ and CX3CR1GFP /+; Sfrp1 −/− microglia; the red line represents linear regression (slope 0.704014 P‐value: < 2.2e‐16 by the F‐test followed by Bonferroni's correction) of the differential expression, indicating response attenuation. Coloured dots represent response, which are exclusive for each genotype as represented in (E).
-
EVenn diagram showing the extent of differential gene expression in response to LPS in CX3CR1GFP /+ or CX3CR1GFP /+; Sfrp1 −/− microglial cells. Fold change (75%) and adjusted P‐value < 0.05 cut‐off by the Wald test corrected for multiple comparisons by the Benjamini and Hochberg method.
-
FHeatmap showing fold changes of regularized log‐transformed gene‐level RNA‐seq counts with hierarchical clustering of samples and differentially expressed genes in response to LPS in CX3CR1GFP /+ or CX3CR1GFP /+; Sfrp1 −/− microglial cells.
