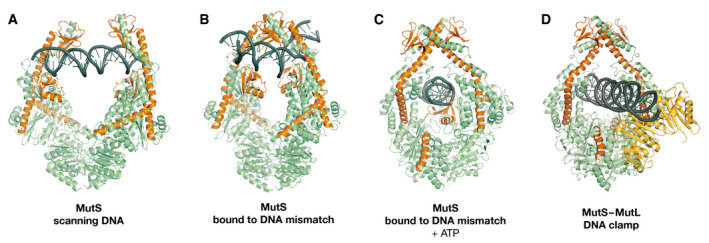
Figure 4. Functional states of MutS.

Structures of scanning MutS (A), mismatch‐bound MutS (B), transition‐state MutS (C), and MutLLN40‐bound MutS (D). Monomer A is shown in green, with monomer B in blue, MutLLN40 in orange, and DNA in black.

Structures of scanning MutS (A), mismatch‐bound MutS (B), transition‐state MutS (C), and MutLLN40‐bound MutS (D). Monomer A is shown in green, with monomer B in blue, MutLLN40 in orange, and DNA in black.