
Figure EV1. Comparison of mTRPV3 and mTRPV3‐Y564A single‐channel activity and osthole inhibition.
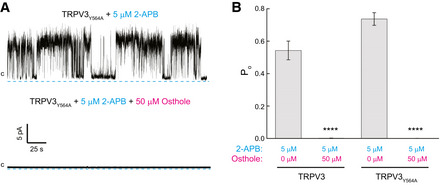
- Representative single‐channel recordings at 80 mV membrane potential from mTRPV3‐Y564A incorporated into a planar lipid bilayer, in response to 5 μM 2‐APB alone or in combination with 50 μM osthole.
- Open probability for mTRPV3 and mTRPV3‐Y564A at 80 mV in the presence of agonist 2‐APB and osthole (0 vs. 50 μM osthole: ****P = 0.7 × 10⁻⁵ for mTRPV3 and ****P = 0.4 × 10⁻⁹ for mTRPV3‐Y564A, n = 9 independent experiments). Statistical significance was calculated using one‐way ANOVA followed by Fisher’s least significant difference test. The data presented are mean ± SEM.