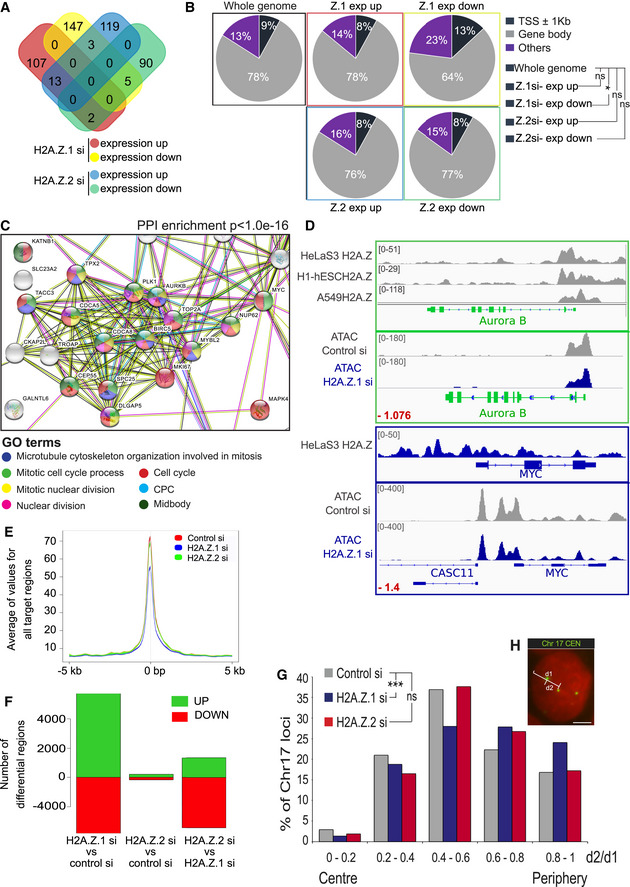
Gene expression of three biological replicates of HeLa cells transfected with control, H2A.Z.1 or H2A.Z.2 siRNA was analysed by RNA sequencing. Venn diagram shows the number of significant (P < 0.01) differentially expressed genes and the overlap between each set of genes.
Pie charts displaying the percentages of H2A.Z peaks at or nearby transcription start sites (TSS) (dark blue), within the gene body (grey) or elsewhere in the whole genome (purple) for the differentially expressed genes following H2A.Z.1 or H2A.Z.2 depletion. A 2‐sample test for equality of proportions was used for the statistical analyses. *P < 0.05; ns, not significant.
Downregulated genes following H2A.Z.1 depletion were analysed by STRING. The image shows the cluster of genes with Gene Ontology (GO) terms related to cell cycle. PPI, protein–protein interaction.
IGV analyses of H2A.Z localisation (from ENCODE) on Aurora B (green) and cMYC (blue) genes showing H2A.Z enrichment at the TSS and at the upstream region, respectively (bottom panels). IGV analyses of ATAC‐seq peaks for control si and H2A.Z.1 si for Aurora B and MYC genes. The number in red represents the log2Ratio H2AZ.1 si/Control si.
Plot representing the average value for all the target regions around the TSS obtained by ATAC‐seq after control, H2A.Z.1 or H2A.Z.2 siRNA.
Plot representing the number of differential chromatin accessibility regions in pairwise comparison. Green (up) represents regions with increased accessibility and red (down) with decreased accessibility.
Distribution of the position within the nucleus of the centromere of Chr17 from the experiment in (H) calculated as the ratio d2/d1. The ratio between d2 and d1 gives the position of the centromere relative to the centre of the nucleus. The graph represents the percentages of centromeres with distances following within the 5 binning categories. At least 500 nuclei were analysed per condition. Data sets were statistically analysed using Chi‐square test for the distribution of signals among the 5 categories. ***P < 0.001.
Representative image of a HeLa nucleus after FISH with Chr17 centromeric probe (green). The distance of the FISH signals from the nucleus periphery was calculated as follows: the distance from the centre of the nucleus to the periphery (d1) and the distance from the centre of the nucleus to the FISH signal (d2) were measured. (scale bar 5 μm).

