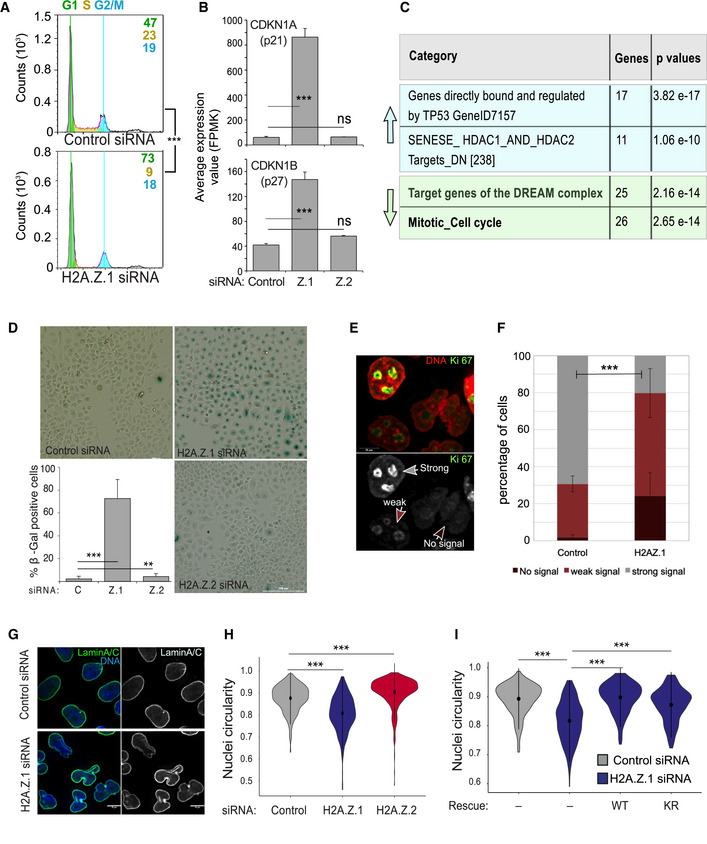
Flow cytometry analysis profiles of control (top) and H2A.Z.1 (bottom) siRNA‐treated HeLa cells. Percentages represent the mean of two biological replicates. Data sets were statistically analysed using Chi‐square test. ***P < 0.001.
CDKN1A (top) and CDKN1B (bottom) average expression values obtained by RNA sequencing of three biological replicates after control, H2A.Z.1 (Z1) or H2A.Z.2 (Z2) siRNA treatment. Error bars show the standard deviation (SD). ***P < 0.001 (Student’s t‐test).
GSEA analyses of the upregulated (light blue upwards arrow) and downregulated (light green downwards arrow) genes upon H2A.Z.1 siRNA indicating the number of genes for category and the relative P‐values.
Representative images of HeLa cells transfected with control, H2A.Z.1 or H2A.Z.2 siRNA and stained for senescence‐associated β‐galactosidase (blue). Scale bar 200 μm. At the bottom‐left, quantification of the percentage of β‐galactosidase‐positive cells. At least 500 cells were counted for each experiment. Error bars show the standard deviation (SD) from two biological replicates. **P < 0.01; ***P < 0.001 (Student’s t‐test).
Representative images of HeLa cell stained for Ki‐67. The arrows indicate the different staining patterns quantified: strong signal (grey arrow), weak signal (light brown arrow) and no signal (dark brown arrow; scale bar 10 μm).
Quantification of the experiment in (E). Error bars indicate the standard deviation from three biological replicates. Data sets were statistically analysed using a Chi‐square test. ***P < 0.001.
Representative images of HeLa cells transfected with control (top) or H2A.Z.1 (bottom) siRNA and stained for Lamin A/C (green). Scale bar = 10 μm.
Violin plots of the nuclear circularity index of HeLa cells transfected with control (grey), H2A.Z.1 (blue) or H2A.Z.2 (red) siRNA. The nuclear circularity was analysed using the NIS Elements AR Analysis software (NIKON). At least 140 nuclei from three biological replicates were analysed for each condition. Mean and SD are shown. Data sets were statistically analysed using the Wilcoxon rank test in R. ***P < 0.001.
Violin plots of the nuclear circularity index of HeLa cells transfected with control (grey) or H2A.Z.1 (blue) siRNA either alone or in combination with siRNA‐resistant GFP:H2A.Z.1WT (WT) or GFP:H2A.Z.1KR (KR) plasmids. The nuclear circularity was analysed using the NIS Elements AR Analysis software (NIKON). At least 140 nuclei from three biological replicates were analysed for each condition. Mean and SD are shown. Data sets were statistically analysed using the Wilcoxon rank test in R. ***P < 0.001.

