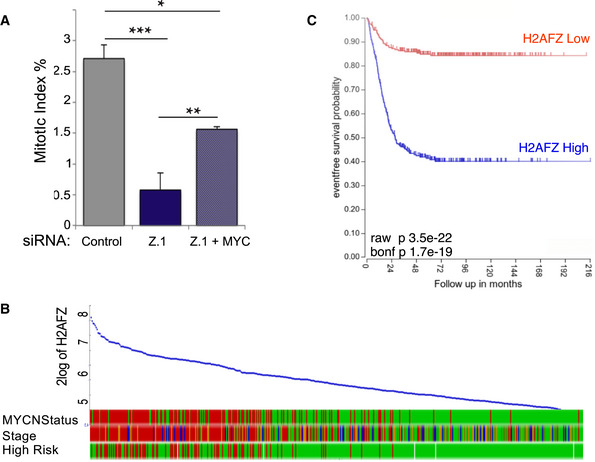
Figure 5. H2A.Z.1 effect on cell cycle is linked to MYC expression.

- Mitotic index (number of mitotic cells/mitotic + interphase cells) of HeLa cells after control si, H2A.Z.1 si or H2A.Z.1 si + GFP:cMYC. Error bars represent standard deviation from two biological replica (control si N = 1,033; H2A.Z.1 si N = 1,042; H2A.Z.1 si + GFP:cMYC N = 1,024). Data sets were statistically analysed using Chi‐square test. *P < 0.05; **P < 0.01; ***P < 0.001.
- Correlation of H2AFZ (H2A.Z.1) expression levels with MYCN status, cancer stage and risk incidence in neuroblastoma patients obtained from R2 genomics.
- Kaplan–Meier survival curve for neuroblastoma patients with low (red) or high (blue) expression of H2AFZ (H2A.Z.1) obtained from R2 genomics.
