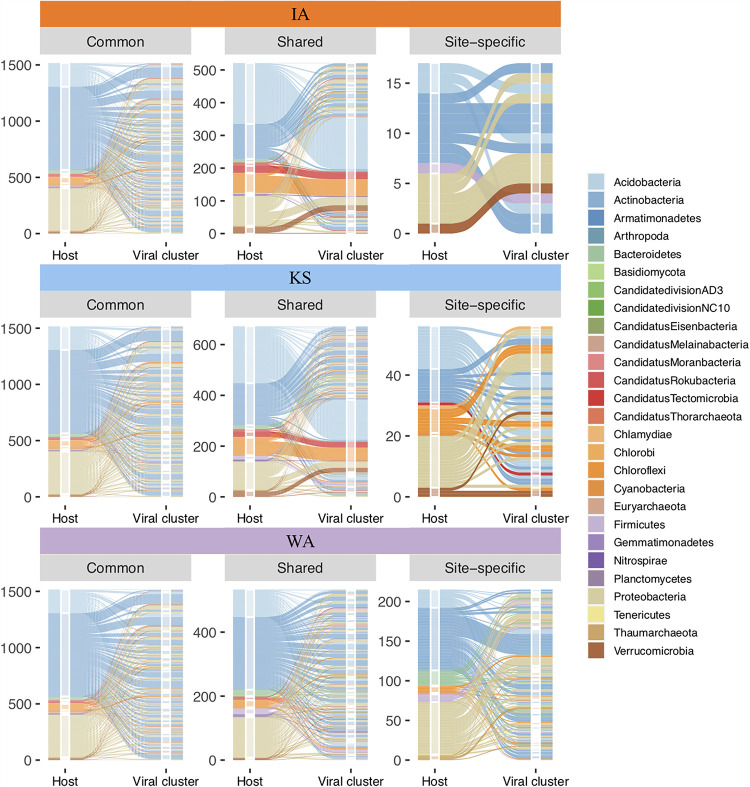
FIG 4.
Predicted virus-host pairing within viral clusters detected in soil metagenomes across a gradient of historical precipitation (Iowa [IA] > Kansas [KS] > Washington [WA]). Alluvial plots illustrate virus-host pairing using the integrated approach described in Fig. 1c (host assignment). The plots are grouped by the grassland soil location (IA, orange; KS, blue; WA, purple). The number of predicted virus-host pairs are shown on the y axis. Within each soil location, virus-host pairs were plotted for viral clusters that were common to all three locations (common), shared among two of three locations (shared), or only found in one location (site-specific). For each plot, the left stratum represents host assignment, colored by phylum, and the right stratum shows viral clusters separated by horizontal white lines. The flow of the pairing is colored by the host lineage assigned. The height of the colored strata demonstrates the relative dominance of each host phylum that the identified soil viruses were predicted to target.

