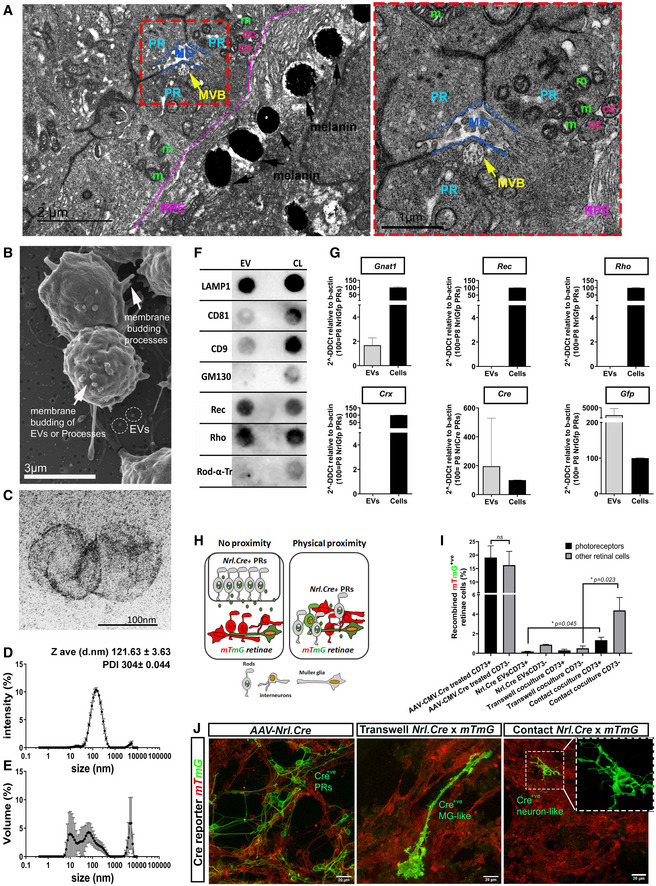
Figure 1. Primary photoreceptors release EVs that exert their function in Müller glial cells but not photoreceptors.

-
ATEM analysis of P7 wt retinae (N = 4 eyes) showing a (photoreceptor‐ Multivesicular Body) PR‐MVB in close proximity to (Muller glia) MG (red dashed box). PR‐photoreceptor cell, MG (blue dashed lines) ‐muller glia cell, MVB (yellow and yellow arrow)‐ multivesicular body, m (green)‐mitochondria, cc (pink)‐connecting cilium, RPE (purple and purple dashed line) ‐retina pigment epithelium, RPE melanin‐black arrows. Scale bar = 2 µm left, 1 µm right.
-
BRepresentative SEM microphotograph of cultured P8 Nrl.Gfp+/+ photoreceptors; arrows indicate membrane budding of processes or EVs; dashed circles denote EVs; Scale bar = 3 µm.
-
CRepresentative TEM microphotograph of 100 K EV pellet derived from Nrl.Gfp+/+ photoreceptor cultures (N = 10 independent preparations); Scale bar = 100 nm.
-
D, ERepresentative dynamic light scatter (DLS) plot of 100 K EV sample (N = 13 samples), showing (D) average intensity and (E) volume against diameter (13 DLS measurements per sample).
-
FRepresentative Dot blot of 100 K EV pellet (each dot represents three pooled EV isolations, derived from 60*106 cells; N = 8 experiments) vs cell lysate (CL) from P8 Nrl.Gfp+/+ photoreceptors. EV markers = LAMP1, CD8, CD9; Golgi marker = GM130; phototransduction markers = Recoverin, Rhodopsin, Rod α‐Transducin.
-
GRT–qPCR analysis of 100 K P8 photoreceptor pellets for Gnat1, Rec, Rho, Crx, Cre and Gfp, relative to β‐actin, comparing EVs (N = 8) against the appropriate (Nrl.Gfp+/+ or Nrl.Cre+/− ) photoreceptor cell lysate (N = 3). Gnat1, Cre and Gfp mRNA were present in all relevant samples.
-
HSchematic representation of Cre‐LoxP system to assess EV function in co‐culture of Nrl.Cre+/− photoreceptors (PRs) with mTmGfloxed reporter retinal cells in non‐proximity (trans‐well) versus physical proximity (contact).
-
IRepresentative flow cytometry analysis of Nrl.Cre+/− and mTmGfloxed co‐cultures. Samples were analysed for expression of myrGFP (recombination) and CD73 (photoreceptor identity) versus CD73−ve fraction (other retinal cells). N > 3 independent cultures for each condition with technical triplicate for each sample; one‐way ANOVA, non‐parametric, Kruskal–Wallis with Dunns’ multiple comparisons test.
-
JRepresentative maximum intensity projection (MIP) confocal images of mTmGfloxed reporter retinal cells, (left) treated with AAV‐Nrl.Cre virus (positive control), (middle) co‐culture with Nrl.Cre+/− photoreceptors separated by trans‐well (non‐proximity) or (right) in contact; Scale bar = 20 µm; Red = myrRFP‐expressing mTmGfloxed reporter, no recombination; green = myrGFP‐expressing mTmGfloxed reporter, cells recombined upon acquiring Cre; blue = nuclei. N = 7 cultures.
Data information: Graphs show mean ± SD.
